Your Serverless Functions Are Running Blind. Fix It.
Stop flying blind in serverless! Nail your APM strategy with 10 pro practices you won't find elsewhere.


Are you sure your serverless strategy is saving money? A startling number of teams aren’t. Internal data from 1985's client audits frequently reveals serverless TCO creeping above traditional VM costs, purely due to observability gaps. You shipped the code. It scales (mostly). But the black boxes are multiplying.
Serverless isn't magic. It’s a trade-off. You swap infrastructure management headaches for state management complexity and distributed systems chaos. Without robust Application Performance Management (APM), you're navigating this chaos with a broken compass. Forget generic advice. These are ten battle-tested practices from the trenches, refined through dozens of 1985 client engagements, designed for leaders who need results, not platitudes.
1. Master Cold Start Diagnostics: Go Beyond the Obvious
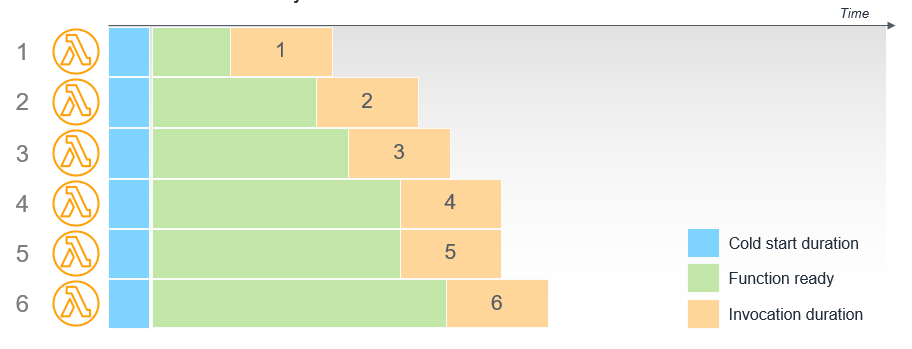
Cold starts are the necessary evil of serverless. Everyone knows they happen. Few diagnose them properly. Simply knowing a function had a cold start is table stakes. Useless.
You need the why. Was it VPC initialization? Heavy dependency loading? Runtime bootstrapping? A 2023 analysis by serverless optimization platform Lumigo highlighted that complex dependencies are a primary driver of extended cold start times, often adding seconds, not milliseconds. Seconds kill conversions. Seconds inflate bills.
1985 War Story: We onboarded a promising e-commerce client whose checkout function suffered intermittent 3-5 second delays. Initial vendor APM flagged "cold starts" but offered no context. Our deep dive revealed the function’s Node.js runtime was re-initializing heavyweight SDKs inside the handler on every cold invocation. Worse, it was connecting to a database within a VPC on each cold start, incurring significant network latency. Refactoring the SDK initialization outside the handler and optimizing the VPC networking cut cold starts by 80%. Revenue followed.
Actionable Takeaway: Instrument cold starts granularly. Use native tools like AWS Lambda Powertools or OpenTelemetry SDKs to capture initialization phase timings separately from handler execution. Tool: AWS Lambda Powertools for Python - Initialization Measurement. Don't just log the event; time the sub-phases.
2. Implement Context-Aware Distributed Tracing: Untangle the Event Spaghetti
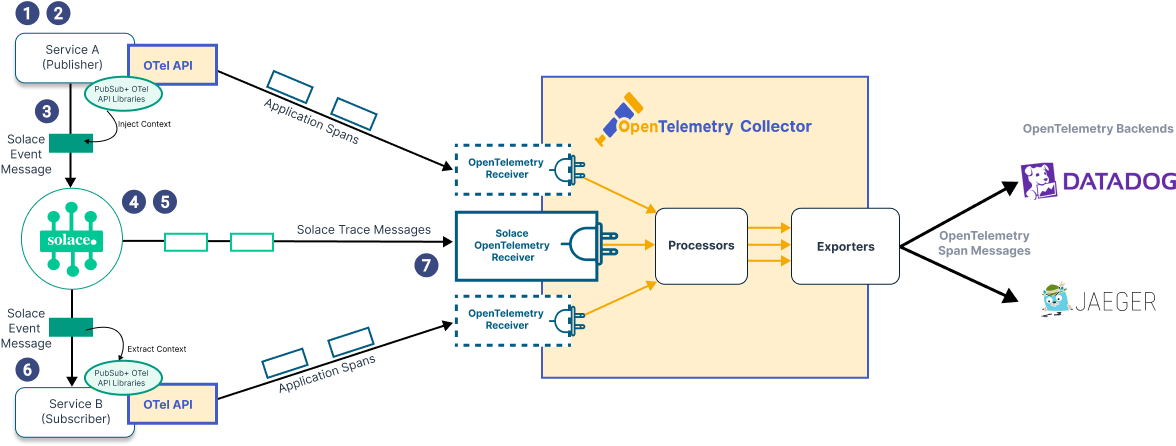
Serverless architectures are event-driven. Functions trigger functions. Queues buffer messages. APIs call APIs. Standard distributed tracing can quickly become a meaningless sprawl of interconnected nodes. You need context.
The challenge isn't just connecting the dots; it's understanding the significance of each connection within a specific business transaction. Did the user registration flow fail because the email notification function timed out, or because the upstream identity service threw an error? A Dynatrace report on cloud complexity underscores that tracing without business context leads to slower MTTR (Mean Time To Resolution). The data is there; the meaning is lost. It's noise.
1985 War Story: A health-tech platform using AWS Step Functions for patient onboarding workflows faced perplexing failures. Their existing APM showed traces, but debugging involved manually correlating dozens of Lambda invocations across SQS queues and SNS topics. It took hours. 1985 implemented trace context propagation using W3C Trace Context headers, injecting the Step Function execution ID and key business identifiers (like patient_id) into every trace span. Suddenly, a single trace ID revealed the entire patient onboarding journey, pinpointing a specific Lambda function failing under load only for patients with large record sizes. Debugging time dropped from hours to minutes.
Actionable Takeaway: Standardize on a trace context propagation format (W3C Trace Context is the emerging standard). Enrich traces with critical business metadata (user IDs, order IDs, transaction types) early in the request lifecycle. Technique: Leverage APM tool features or OpenTelemetry context propagation to automatically inject and correlate these identifiers across function boundaries, queues, and event buses.
3. Correlate Performance Directly with Cost Anomalies: Follow the Money
Serverless billing is granular. Per-millisecond execution time. Per-request charges. This is powerful but dangerous. Performance regressions don't just impact UX; they directly hit your bottom line. An inefficient function running thousands of times daily can silently drain your budget.
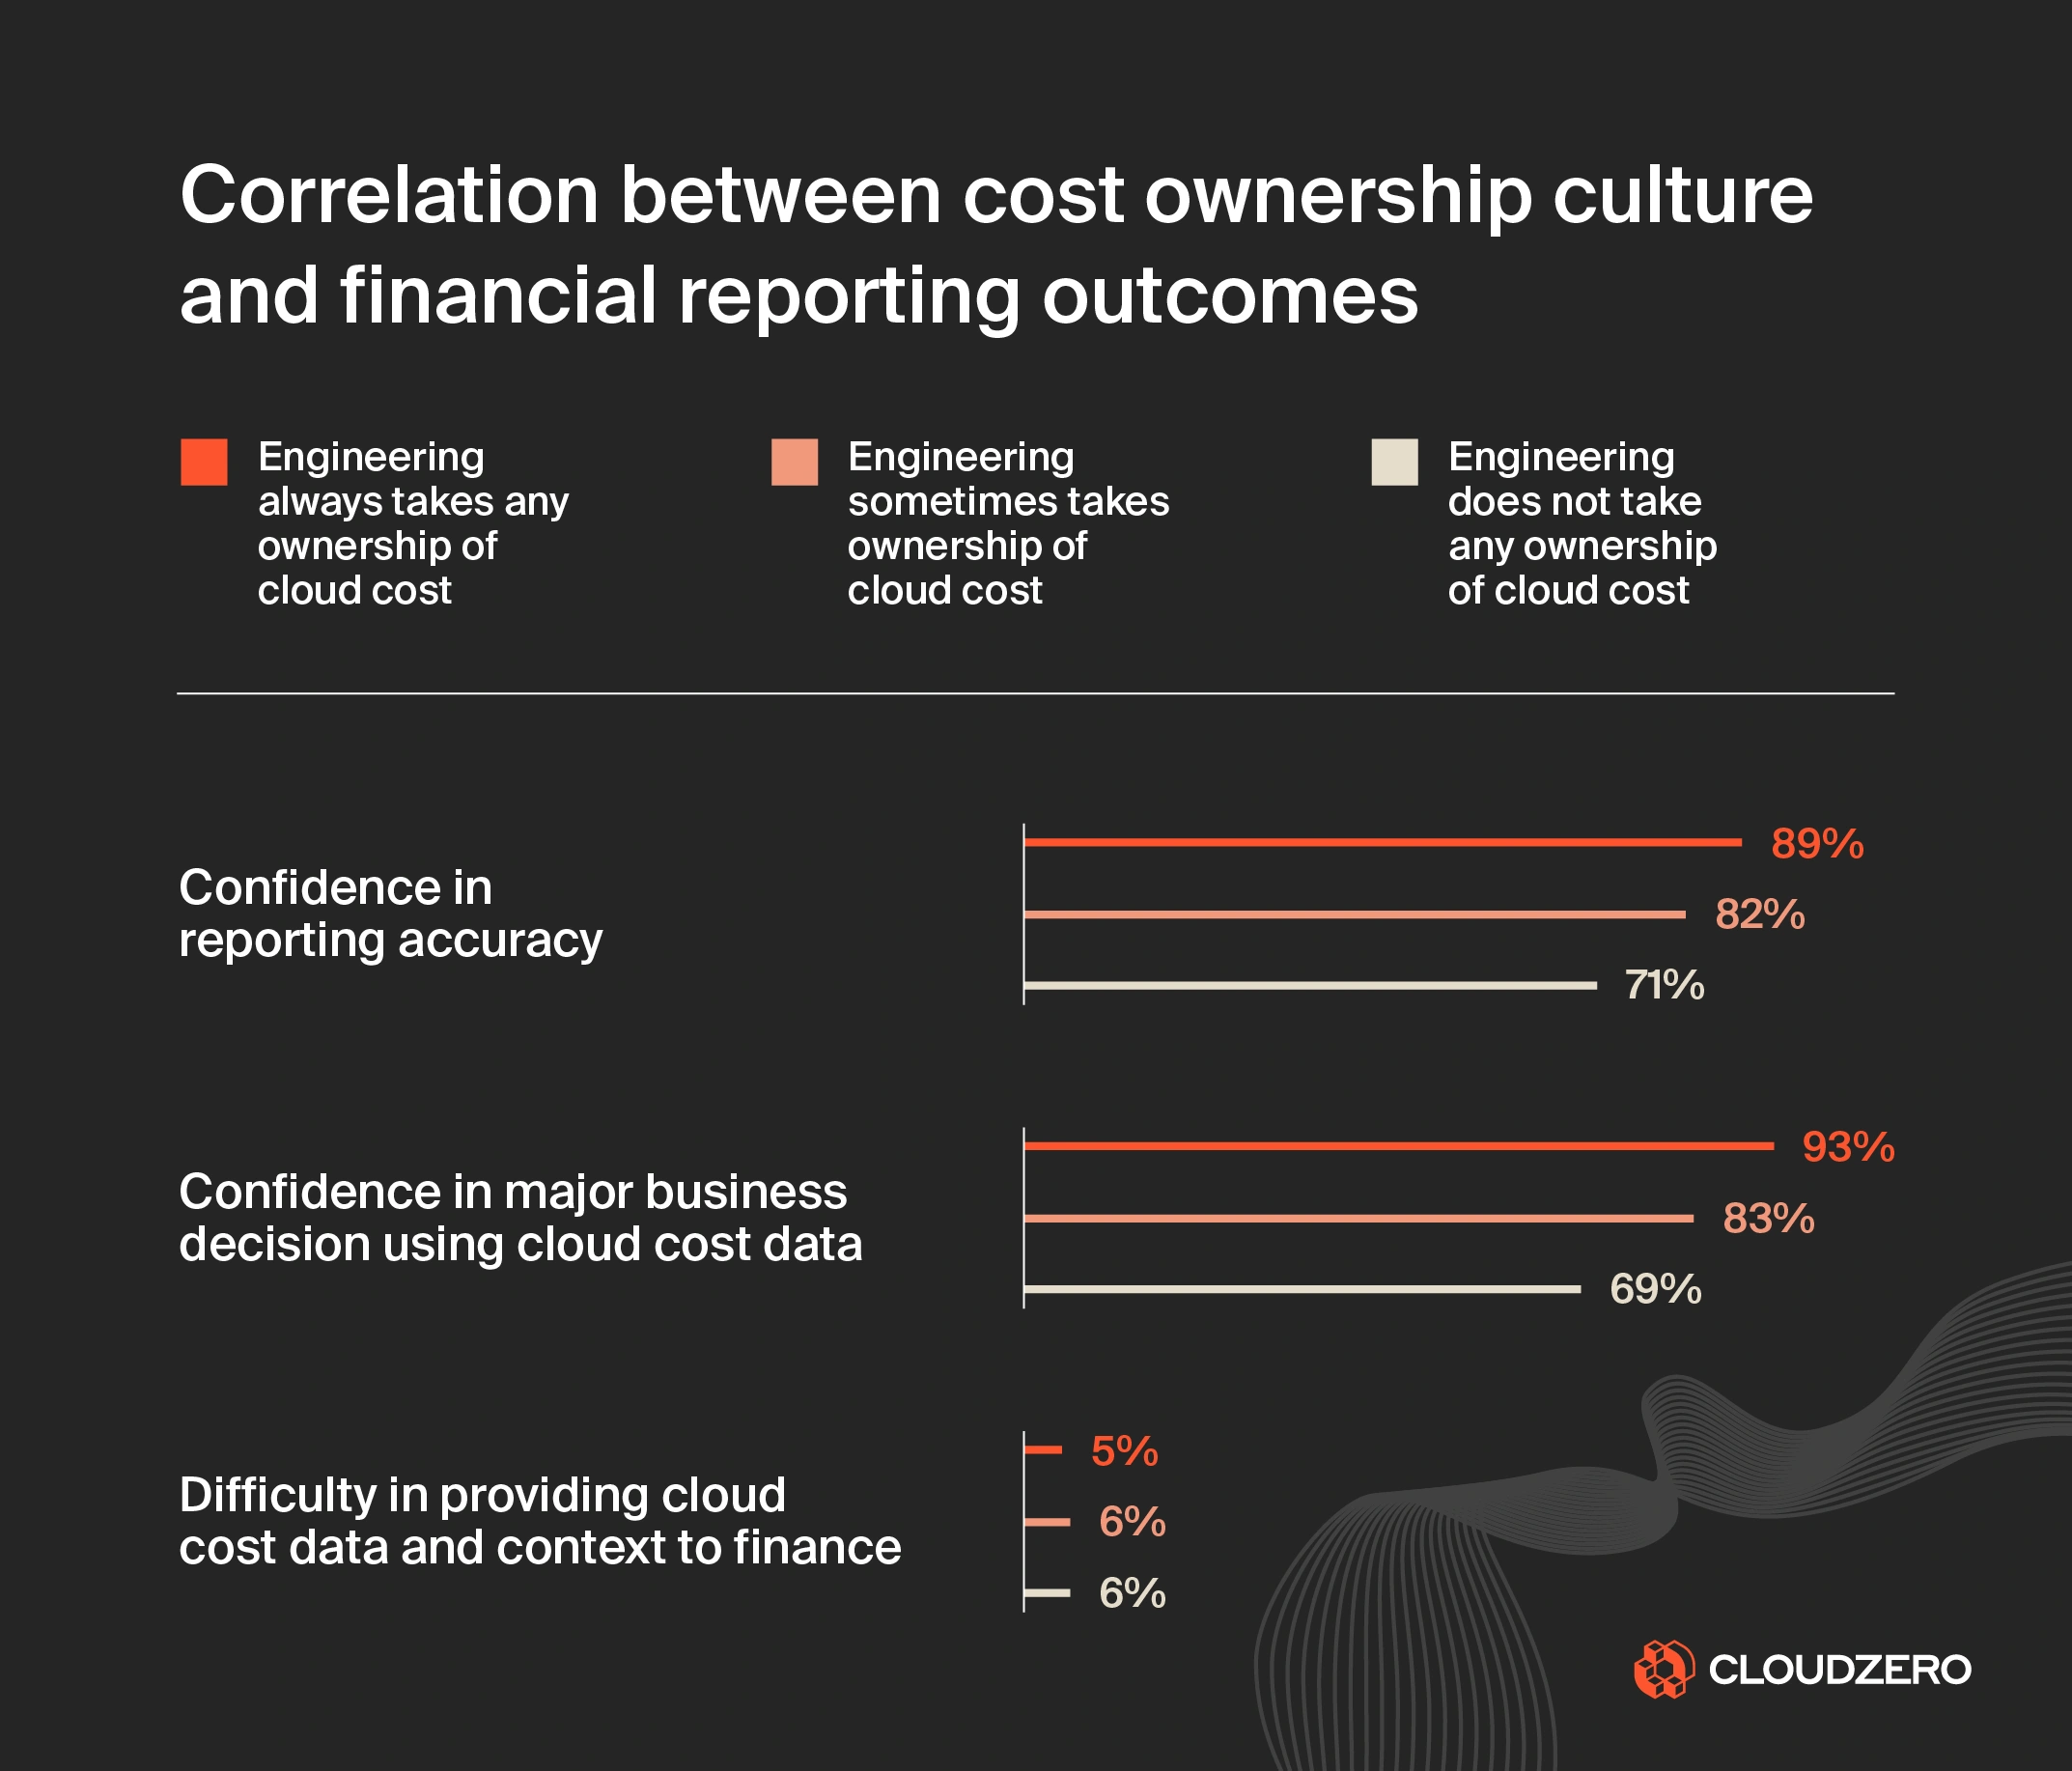
Most APM tools report latency and errors. Few directly overlay this with granular cost data. You need to see that a spike in P99 latency for function-X coincided exactly with a 30% jump in its associated cost. According to Forrester research on cloud cost management (summary, full report behind paywall), lack of visibility is a primary driver of cloud waste. In serverless, performance is cost.
Pull Quote:
"We stopped thinking about serverless performance and cost as separate metrics. They are two sides of the same coin. An inefficient query isn't just slow; it's expensive, multiplied by a million invocations."
– Anonymous CTO, FinTech Client via 1985 Engagement Debrief
1985 War Story: A media streaming client saw their AWS bill unexpectedly surge. Standard cost explorers pointed to Lambda, but not why. Our team integrated APM traces with detailed CloudWatch cost metrics. The culprit? A newly deployed function performing image resizing was allocating excessive memory (3GB) for tasks needing only 512MB. While latency was acceptable, the over-allocation, triggered millions of times, dramatically inflated costs. Tuning the memory allocation saved them five figures monthly. Without correlating performance configuration to cost, this was invisible.
Actionable Takeaway: Integrate your APM data with cloud provider billing/cost dashboards. Look for tools or build custom dashboards that plot latency/error rates alongside function-level cost data. Tool: Leverage cloud provider cost tags and APM metadata tagging consistently. Explore tools like AWS Cost Explorer with resource tagging, or third-party FinOps platforms that ingest APM data.
4. Employ Intelligent Error Aggregation & Prioritization: Denoise the Failure Signals
Serverless functions can generate a lot of errors. Transient network hiccups, downstream API blips, throttling events. Logging every single one is noise. Alerting on every failure creates crippling fatigue. You need signal, not static.
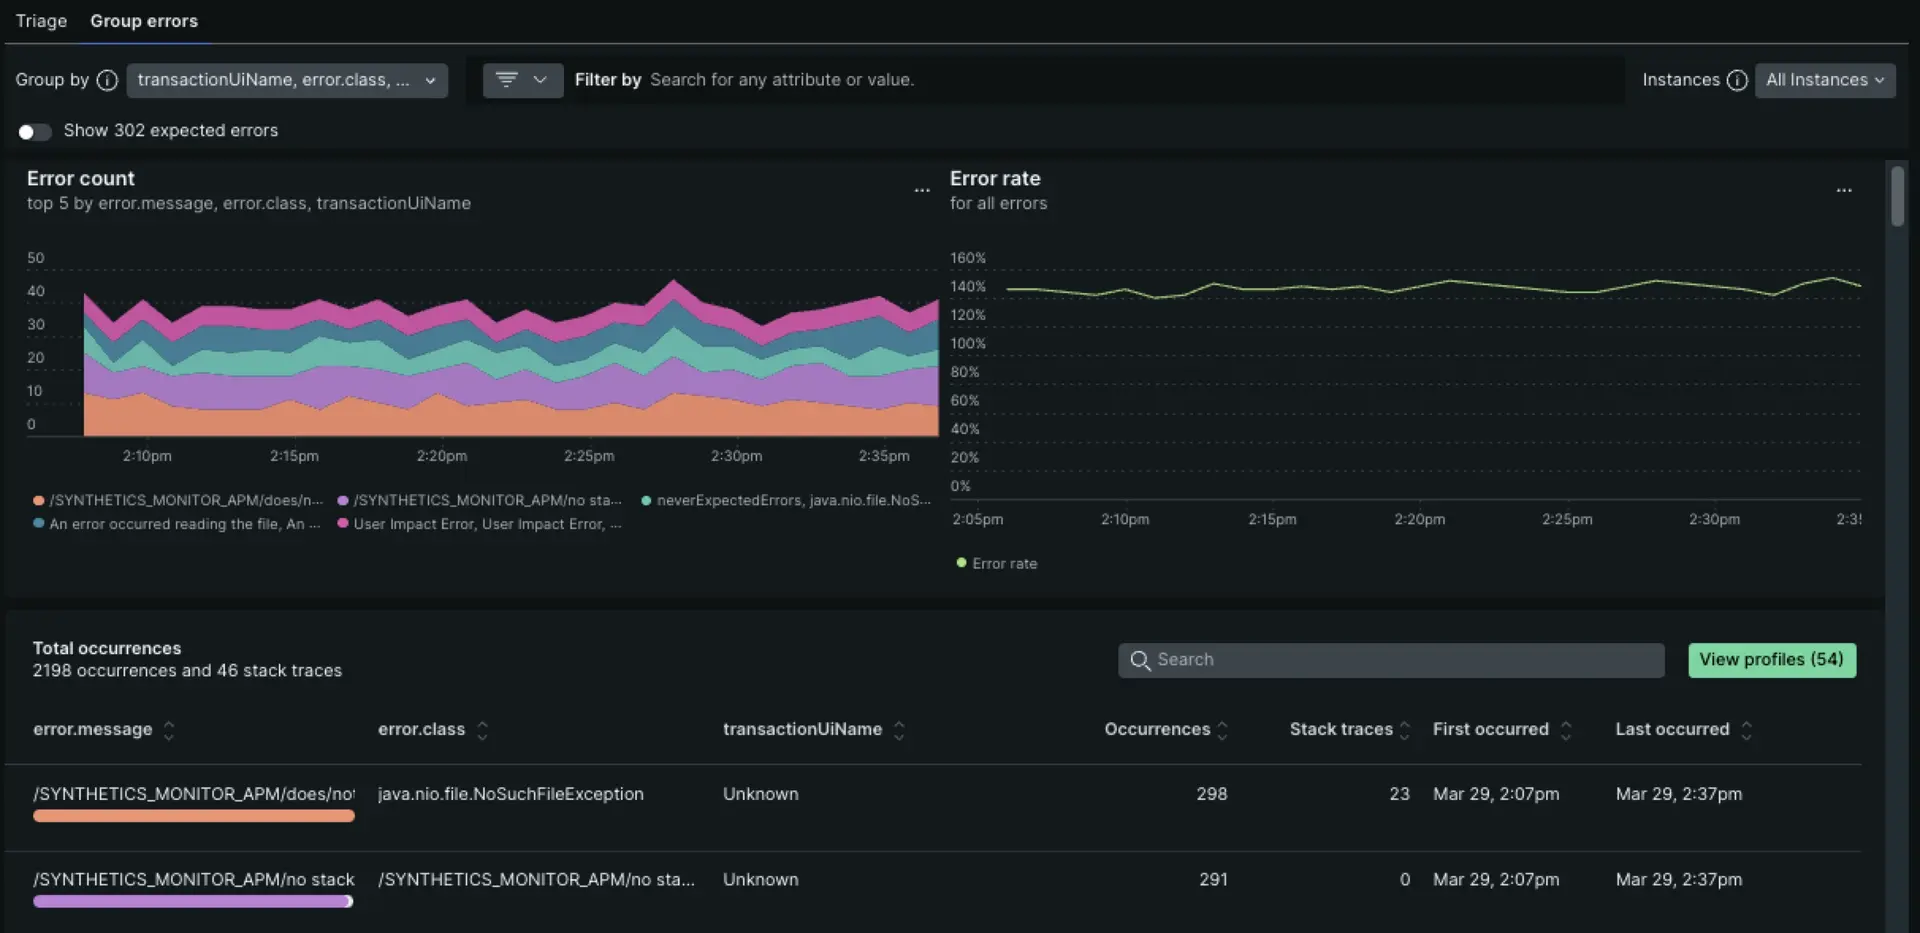
The key is intelligent aggregation. Group errors not just by function name or exception type, but by impact. Are these errors affecting critical user paths? Are they correlated with specific deployment versions or user segments? A study cited by Rollbar indicated that developers spend significant time dealing with errors, and noise is a major productivity killer. Smart aggregation turns raw error data into actionable intelligence.
1985 War Story: A SaaS client's development team was drowning in error alerts from their serverless backend. Thousands per day. Most were transient timeouts calling a third-party enrichment API. Morale was low, real issues were missed. 1985 helped implement error grouping logic within their APM tool (Datadog in this case) based on custom fingerprints. We grouped timeouts to the specific third-party endpoint, tagged them as 'transient/low-priority', and only alerted if the rate exceeded a baseline anomaly threshold. Critical path errors (e.g., payment processing failures) were given high priority. Alert volume dropped by 95%, allowing the team to focus on impactful bugs.
Actionable Takeaway: Configure your APM tool's error tracking to group aggressively based on stack trace signatures, error messages, and custom metadata (like impacted user flow or business transaction). Prioritize alerts based on business impact, not just raw count. Technique: Use APM fingerprinting rules and custom attributes to distinguish between transient noise and genuine regressions.
5. Isolate Platform Throttling from Application Bottlenecks: Know Your Limits
"My function is slow!" Is it your code, or is the platform throttling you? In serverless, you operate within shared resource pools and account limits (concurrency, API Gateway quotas, queue throughput). Hitting these limits manifests as increased latency or outright errors, easily mistaken for application bugs.
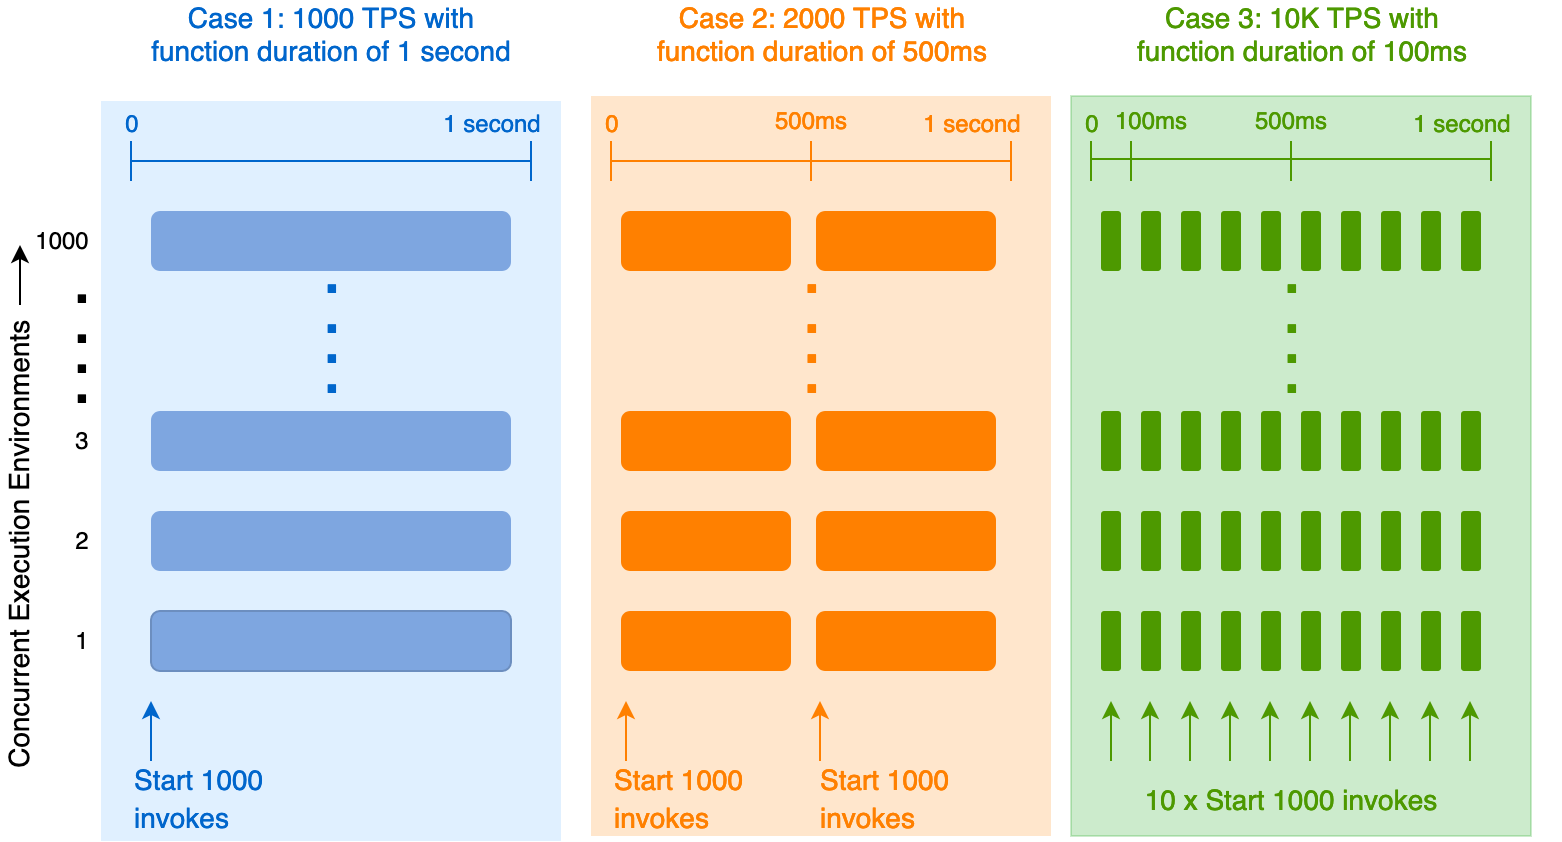
Distinguishing platform limitations from code inefficiencies is crucial. AWS documentation outlines various Lambda function scaling and concurrency limits. Ignoring these is a recipe for performance chaos. Your APM needs to surface throttling events clearly, distinct from standard application errors or latency spikes.
1985 War Story: A logistics company using serverless for real-time shipment tracking experienced periodic system slowdowns during peak hours. Initial suspicion fell on inefficient database queries within their core tracking Lambda. However, 1985's analysis using correlated CloudWatch metrics within their APM (specifically ThrottledInvocations and ConcurrentExecutions) revealed they were hitting the regional Lambda concurrency limits. The "slowdown" wasn't the code; it was the platform queueing requests. The fix wasn't code optimization, but requesting a concurrency limit increase and optimizing upstream invocation patterns.
Actionable Takeaway: Ensure your APM solution ingests and clearly visualizes platform-level metrics alongside application metrics. Monitor AWS CloudWatch metrics like Throttles (Lambda), 4XXError/5XXError (API Gateway), ApproximateAgeOfOldestMessage (SQS). Dashboard Tip: Create a dedicated dashboard correlating function latency/errors with key platform limit metrics for critical workflows.
6. Instrument and Baseline Third-Party API Dependencies: Monitor Your Ecosystem
Your serverless application rarely lives in isolation. It calls payment gateways, identity providers, data enrichment services, marketing APIs. A slowdown or failure in any of these external dependencies directly impacts your application's performance and reliability. You need to monitor them as rigorously as your own code.
Simply knowing your function timed out isn't enough. You need to know which downstream call caused the timeout and how often that dependency is performing poorly. Stripe's Developer Coefficient report often highlights the importance of API reliability and developer experience – poor API performance is a major drag on productivity (though a bit dated, the principle holds). Treat external APIs as first-class citizens in your monitoring strategy.
1985 War Story: An online learning platform experienced intermittent failures during user signup. The trace showed their createUser function failing, but the logs were ambiguous. 1985 implemented detailed APM instrumentation around the function's external calls. It quickly became clear that calls to a third-party address validation API were timing out sporadically, but only for users in specific geographic regions. Armed with this data (latency spikes and error rates correlated with the specific API endpoint), the client could have a productive conversation with the API provider, leading to a fix. Without dependency-specific metrics, they were flying blind.
Actionable Takeaway: Use your APM tool's capabilities to automatically instrument outbound HTTP requests or explicitly wrap SDK calls to external services. Track latency, error rates, and payload sizes for each critical dependency. Establish performance baselines and alert on deviations. Table:
| Dependency Metric | Why Track It | Actionable Insight |
| P90/P99 Latency | Identify slowdowns impacting user experience | Optimize calls, negotiate SLAs, consider alternatives |
| Error Rate | Detect reliability issues | Implement retries/circuit breakers, contact provider |
| Request/Response Size | Understand cost/performance impact | Optimize payloads, check for unexpected data |
| Call Frequency | Monitor usage patterns & potential costs | Optimize caching, ensure efficient usage |
7. Track Configuration Changes as Performance Events: Connect Deployments to Outcomes
You deployed a new Lambda function version with reduced memory. Suddenly, latency spikes. You tweaked an API Gateway timeout setting. Now you see more 5XX errors. Configuration changes – deployments, environment variable updates, infrastructure tweaks – are often the root cause of performance regressions. Your APM should treat these changes as significant events.
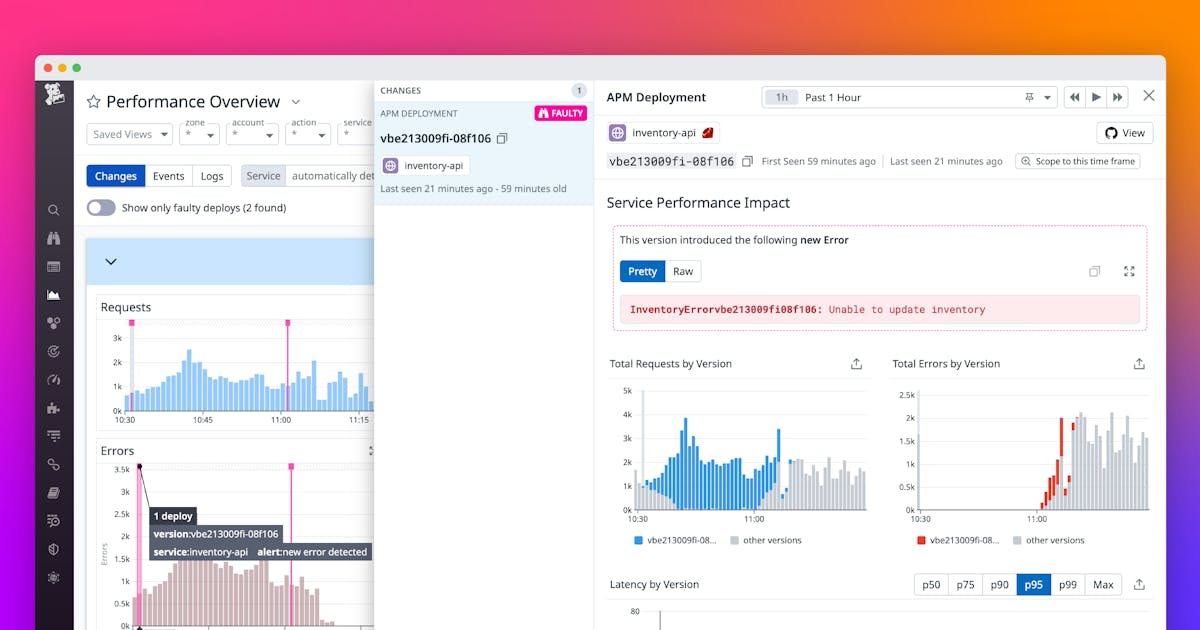
Correlating deployment markers or configuration change events directly onto your performance graphs is invaluable. It turns debugging from a guessing game ("What changed around 2 PM yesterday?") into a targeted investigation ("Performance degraded right after deployment X. Let's examine those changes."). Tools like AWS CodeDeploy provide hooks, and many CI/CD platforms allow event pushing to APM tools. Leverage them.
1985 War Story: A fintech client using a blue/green deployment strategy for their core transaction processing API saw intermittent P99 latency spikes after releases. Debugging was slow, requiring manual correlation of deployment times with performance charts. 1985 integrated their Jenkins CI/CD pipeline to push deployment events (start/end/rollback, version ID) directly into their APM tool (New Relic). The next time latency spiked post-deployment, the marker was right there on the graph. Clicking it instantly filtered the timeframe, showing the regression began exactly when the new version took 100% of traffic. A quick rollback, analysis (revealed an inefficient third-party call added in the new version), and fix followed rapidly.
Actionable Takeaway: Integrate your CI/CD pipeline and infrastructure-as-code tools with your APM system. Automatically push deployment events, feature flag changes, and significant infrastructure modifications as event markers onto your performance timelines. Technique: Use APM provider APIs or built-in integrations (e.g., Jenkins plugins, GitHub Actions) to send these events during your deployment process.
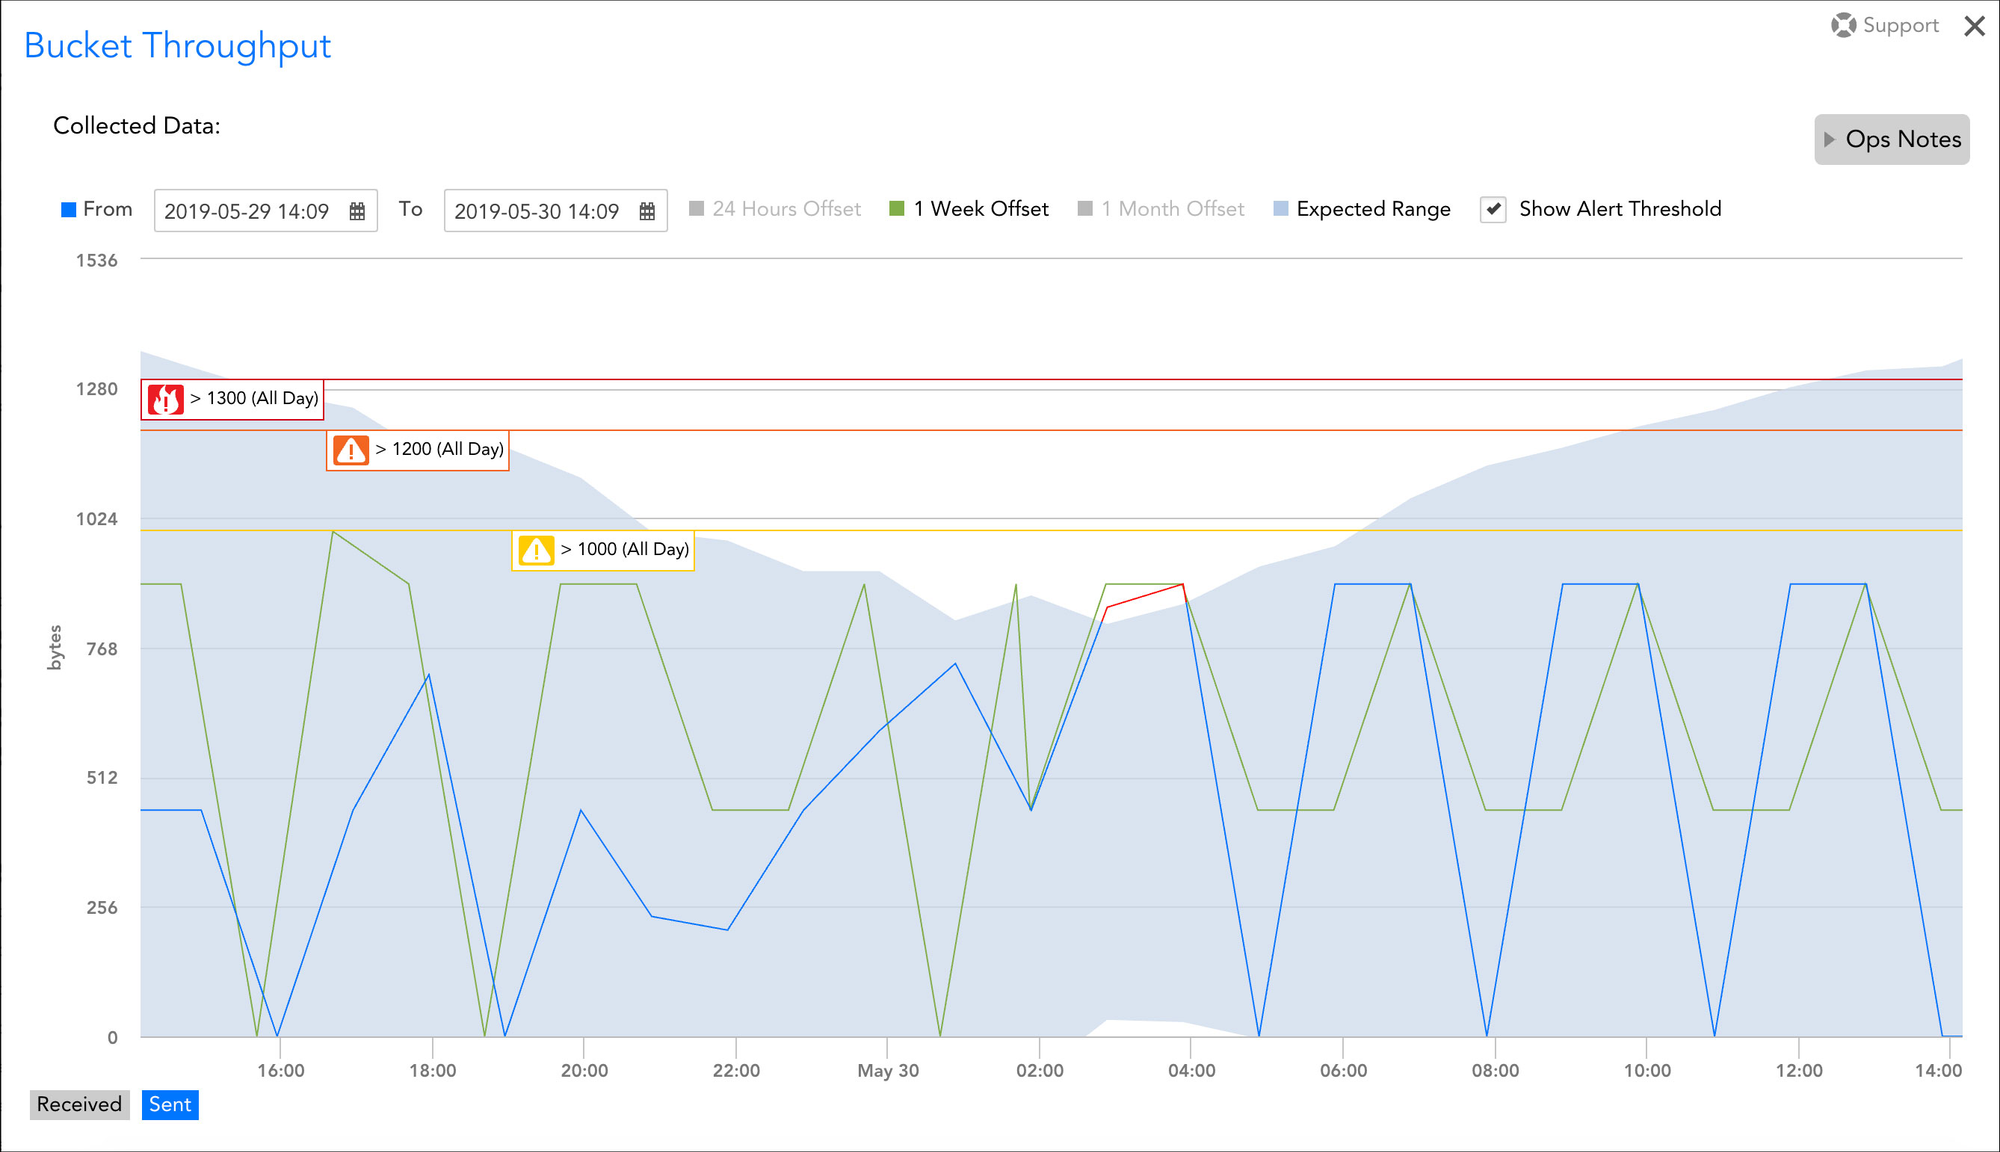
8. Shift from Threshold Alerts to Adaptive Anomaly Detection: Embrace Dynamic Baselines
Static thresholds ("Alert if P99 latency > 500ms") are brittle in dynamic serverless environments. Traffic patterns fluctuate. Underlying platform performance varies. A fixed threshold might be too noisy during peaks or too insensitive during troughs. You need alerting that learns.
Adaptive anomaly detection uses machine learning to understand your application's normal behavior (including seasonality and trends) and alerts only when metrics deviate significantly from this learned baseline. This dramatically reduces alert fatigue and surfaces genuinely unusual behavior. Gartner's research on AIOps consistently points to anomaly detection as a core capability for managing complex, dynamic systems. Static thresholds belong to the past.
1985 War Story: A gaming company client relied heavily on serverless functions for leaderboard updates. They initially set static latency thresholds but were constantly fighting false positives during tournaments (high load) and missing subtle regressions during off-peak hours. 1985 helped them configure adaptive anomaly detection within their APM tool. The system learned the hourly/daily patterns. Now, alerts trigger only for unexpected spikes relative to the time of day and recent history, catching subtle issues like a gradual performance degradation in a background processing function that static thresholds missed entirely.
Actionable Takeaway: Leverage your APM tool's built-in anomaly detection features. Invest time in configuring them properly, potentially seeding them with historical data. Focus anomaly detection on key business KPIs and critical service metrics rather than trying to apply it everywhere initially. Transition: Gradually phase out noisy static threshold alerts in favor of adaptive ones as confidence in the anomaly detection grows.
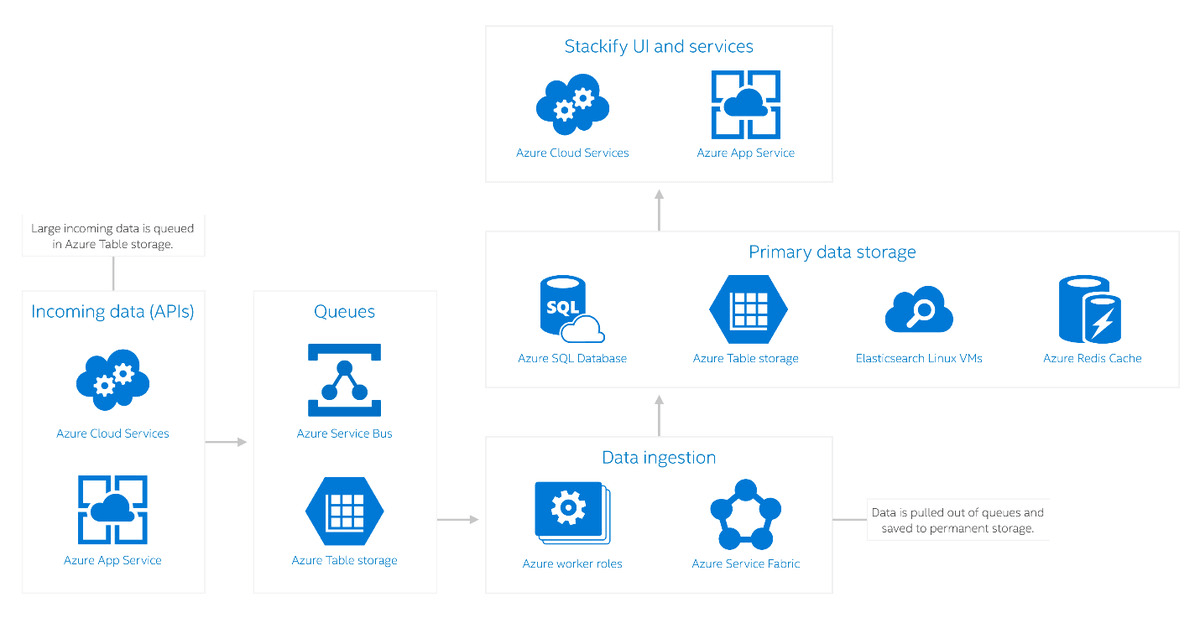
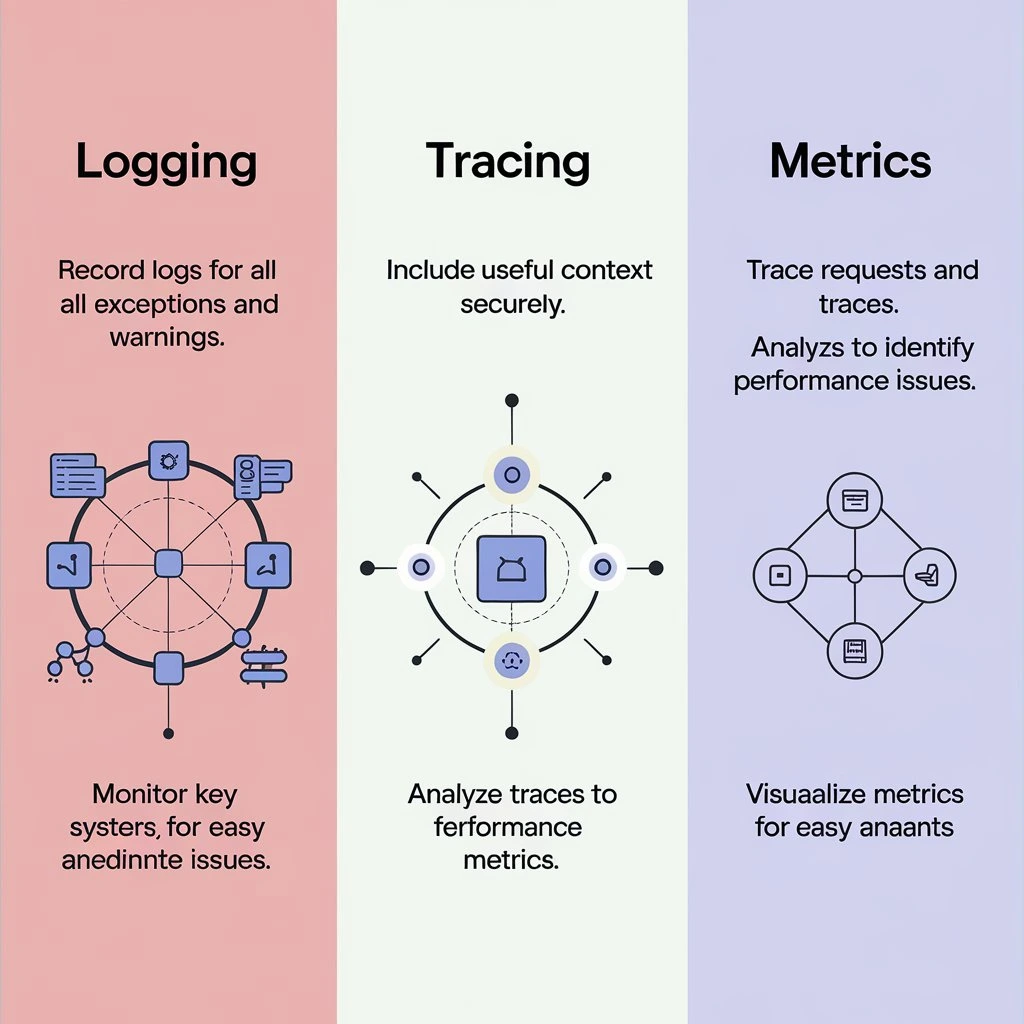
9. Unify Logs, Metrics, and Traces for Holistic Insight: Break Down Data Silos
APM (traces & metrics) tells you what happened and where. Logs tell you why. In serverless, where state is distributed and execution is ephemeral, you absolutely need all three pillars of observability—metrics, traces, and logs—correlated and accessible from a single pane of glass.
Switching between your APM tool, your logging platform (e.g., CloudWatch Logs, Splunk), and your metrics dashboard kills productivity during incident response. The "aha!" moment often comes when you jump from a specific slow trace span directly to the corresponding detailed logs for that exact invocation. A study by IEEE on software debugging (abstract, full paper often requires access) implicitly supports this, noting the time cost of context switching. Unified observability isn't a luxury; it's a necessity.
1985 War Story: A client building a serverless data processing pipeline struggled to diagnose intermittent data corruption issues. Traces showed functions completing successfully, but downstream data was wrong. Metrics looked normal. The breakthrough came when we configured their logging library (using Lambda Powertools) to automatically inject the current trace ID into every log statement. Within their APM (which also ingested logs), they could click on a trace representing a processed data batch, then instantly see only the logs associated with that specific trace ID across multiple function invocations. This quickly revealed subtle data transformation errors logged within one specific function, invisible without the trace-log correlation.
Actionable Takeaway: Choose APM and logging solutions that integrate seamlessly. Ensure trace IDs are automatically injected into logs. Configure your APM tool to link traces to corresponding logs (and vice-versa). Priority: Ensure developers can navigate fluidly between trace spans, metrics graphs, and related log entries within a single interface or with minimal clicks.
10. Standardize Tagging for Cross-Service Correlation: Build a Common Language
In a complex serverless application, consistent tagging is the glue that holds your observability data together. How do you filter traces, metrics, and logs for a specific feature, customer tier, or deployment environment if there's no common identifier? Chaos ensues.
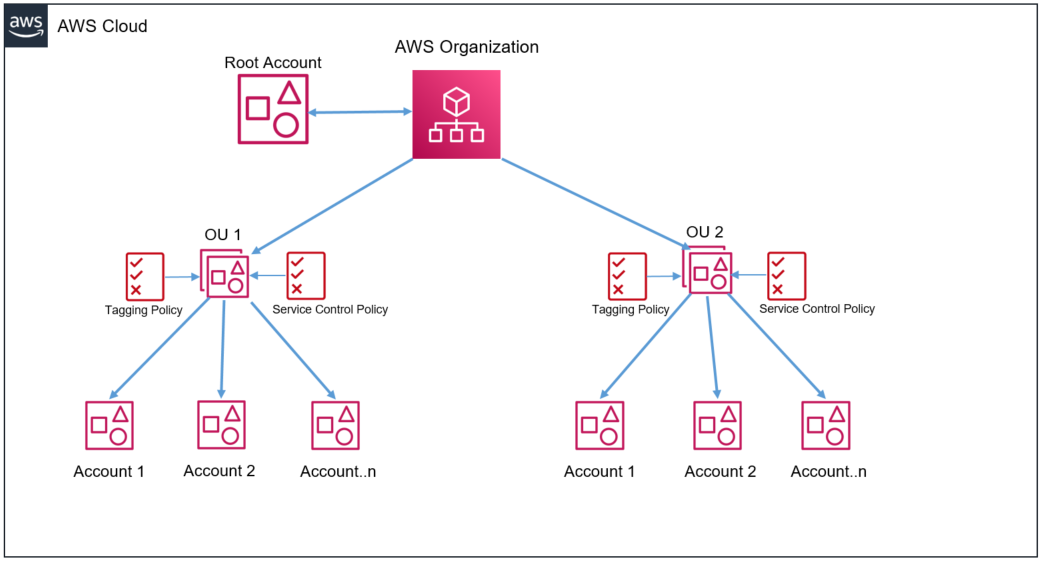
Define and enforce a standardized tagging strategy across all functions, resources (queues, tables, gateways), and observability data (traces, logs, metrics). Tags like service_name, environment, feature_flag, owner_team, and customer_id (where appropriate) allow you to slice and dice your data effectively. OpenTelemetry semantic conventions provide a good starting point for standardized attribute names. Consistency is paramount.
1985 Enforcement: One rule we enforce early in 1985 engagements involving serverless is the mandatory tagging checklist within the CI/CD pipeline. Builds fail if core tags (service, env, team) are missing from serverless function configurations or instrumentation. It seems strict, but it pays dividends weeks later when the first major incident hits, and filtering data isn't a frantic scramble but a precise action. We saw a client reduce incident diagnosis time by 40% just by implementing consistent tagging across their 100+ microservices and functions.
Actionable Takeaway: Develop a clear, documented tagging policy for your serverless resources and observability data. Automate enforcement through IaC linting (e.g., cfn-lint, terraform validate) and CI/CD checks. Tool: Use AWS Resource Tagging, Lambda function tags, and APM/OpenTelemetry attribute conventions consistently. Regularly audit for tag compliance.
Beyond the Checklist: Is Your Partner Ready?
Implementing these practices requires more than just buying an APM tool. It demands deep expertise in serverless architectures, observability patterns, and often, significant cultural shifts in how teams build and monitor software.
Generic outsourcing partners often stumble here. They might implement basic monitoring, but they lack the nuanced understanding to tame cold starts effectively, correlate cost with performance, or build truly context-aware tracing. They treat observability as an afterthought, not the foundation of reliable serverless operations.
Ask yourself: Can your current development partner, in-house or outsourced, confidently address these challenges?
- Diagnose cold starts beyond simple identification?
- Implement meaningful distributed tracing with business context?
- Directly correlate function performance to granular cost impact?
- Filter signal from noise in high-volume error reporting?
- Distinguish platform limits from application code issues?
If the answer to any of these is uncertain, your serverless investment is at risk.
At 1985, observability isn't a feature; it's embedded in our process. We build and manage serverless applications designed for visibility from day one. If you're tired of flying blind in the serverless cloud and need a partner who brings niche expertise, not generic promises, let's talk. We can start with an audit of your current observability stack. Don't let invisibility kill your serverless advantage.


