Measuring the Productivity and Efficiency of Outsourced Teams
Learn industry-specific metrics that turn code into success for outsourced tech projects.


Every day, I witness firsthand the complexities and triumphs of working with distributed teams. We are in the business of turning ideas into code. Yet, when it comes to measuring productivity and efficiency, many questions arise. How do you know if your outsourced team is performing at its peak? How do you balance quality, speed, and cost? This post dives deep into these questions, offering a blend of hard data, real-life insights, and a conversational tone that mirrors the day-to-day reality of managing outsourced teams.
In today’s competitive market, every line of code and every sprint matters. Short, punchy sentences often capture a moment. But behind those moments lies a deeper story. There are trade-offs, strategies, and metrics that tell a tale of success or need for improvement. Let’s explore this topic with a mix of practical insights and industry-specific analysis.

The Landscape of Outsourced Software Development
Outsourcing is not a new phenomenon. But the way we measure productivity has evolved. Gone are the days when counting hours was enough. Today’s agile environments demand a more nuanced approach. Outsourced teams work across borders and time zones. Communication is instant. Yet, measuring their productivity remains a challenge.
Every project is unique. No single metric can capture the entirety of a team's performance. We must look beyond the surface and dive into multiple dimensions: quality, speed, efficiency, and even team morale. As someone deeply entrenched in this field, I’ve seen how a one-size-fits-all approach can lead to misinterpretation and missed opportunities for improvement.
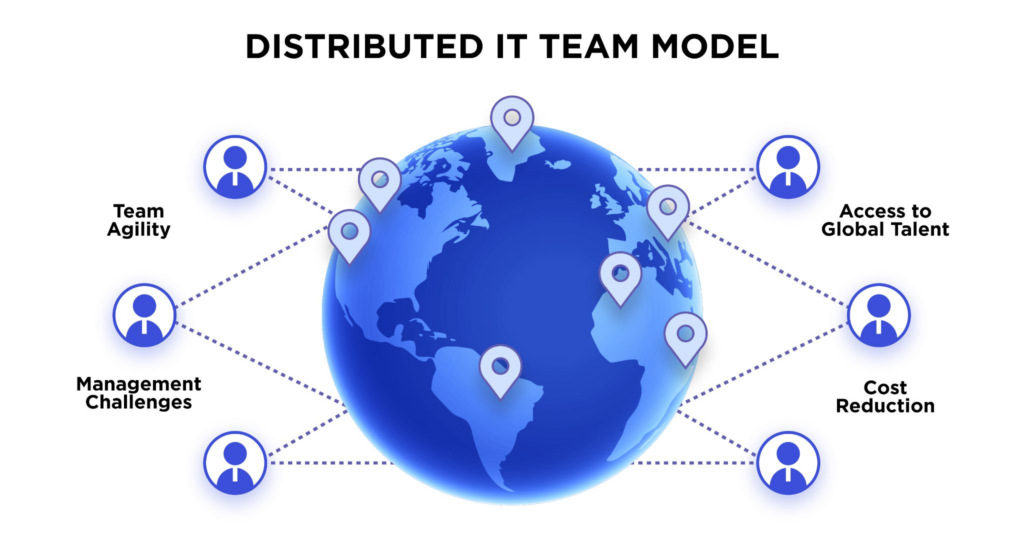
Outsourced teams often operate in environments where direct oversight is limited. Trust is key. Yet, trust must be built on measurable outcomes. That’s why we rely on a blend of quantitative data and qualitative insights. The goal is to create a comprehensive view of performance. This approach is not only logical—it’s essential in today’s distributed work landscape.
Core Metrics: Beyond the Basics
When it comes to measuring productivity, you must be precise. We need metrics that reflect real work done, not just time spent. Here are some key performance indicators (KPIs) that matter:
Velocity and Throughput
Velocity is a popular metric in agile development. It measures how much work (often in story points) a team completes in a sprint. But remember, velocity is only meaningful when consistently measured over time. It helps in forecasting future sprints and adjusting workloads.

Throughput takes a slightly different angle. It measures the number of tasks or features completed over a specific period. This metric gives insight into the team’s overall capacity and helps identify bottlenecks.
For instance, one of our projects at 1985 recently had an average velocity increase from 30 to 40 story points per sprint over six months. This was not a fluke. It resulted from improved collaboration tools, refined sprint planning, and better backlog grooming. Such a shift is a sign of increasing efficiency and productivity.
Quality Metrics
Quality is not a mere checkbox. It’s the backbone of any software project. Here are the metrics we focus on:
- Defect Density: The number of defects per thousand lines of code. A lower defect density indicates cleaner, more reliable code.
- Code Churn: Measures the number of lines added, modified, or deleted over a certain period. High churn might signal instability in the codebase.
- Test Coverage: The percentage of code covered by automated tests. Higher test coverage often correlates with fewer bugs and easier maintenance.

These quality metrics offer a clear window into the stability and reliability of the output. It is vital to balance speed with quality. Delivering a feature quickly is impressive. But if it’s buggy, it hurts the project. Many teams struggle with this balance, and it’s where data becomes a guiding light.
Efficiency Metrics
Efficiency isn’t just about speed—it’s about doing things right the first time. We track:
- Cycle Time: The time it takes for a task to move from start to finish. Shorter cycle times usually indicate efficient processes.
- Lead Time: The time from the moment a request is made until the feature is delivered. This metric is particularly important in agile teams.
- Resource Utilization: How effectively the team’s skills and time are being used. This metric helps in identifying overworked teams or areas where extra resources may be needed.

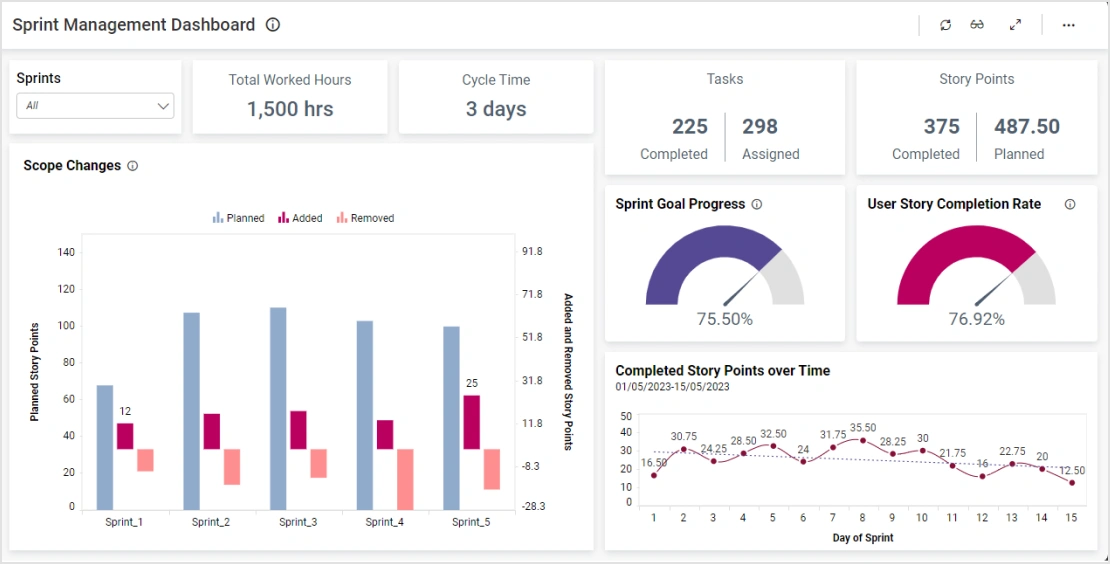
A table below illustrates a typical dashboard we use at 1985:
Each of these metrics tells a story. They are the narrative behind every code commit, every bug fix, and every sprint review. They are not infallible but, when combined, they offer a robust picture of team performance.
Tools and Techniques for Measurement
To measure these metrics accurately, you need the right tools. In the world of outsourced software development, a diverse set of platforms and methodologies come into play.

Project Management Software
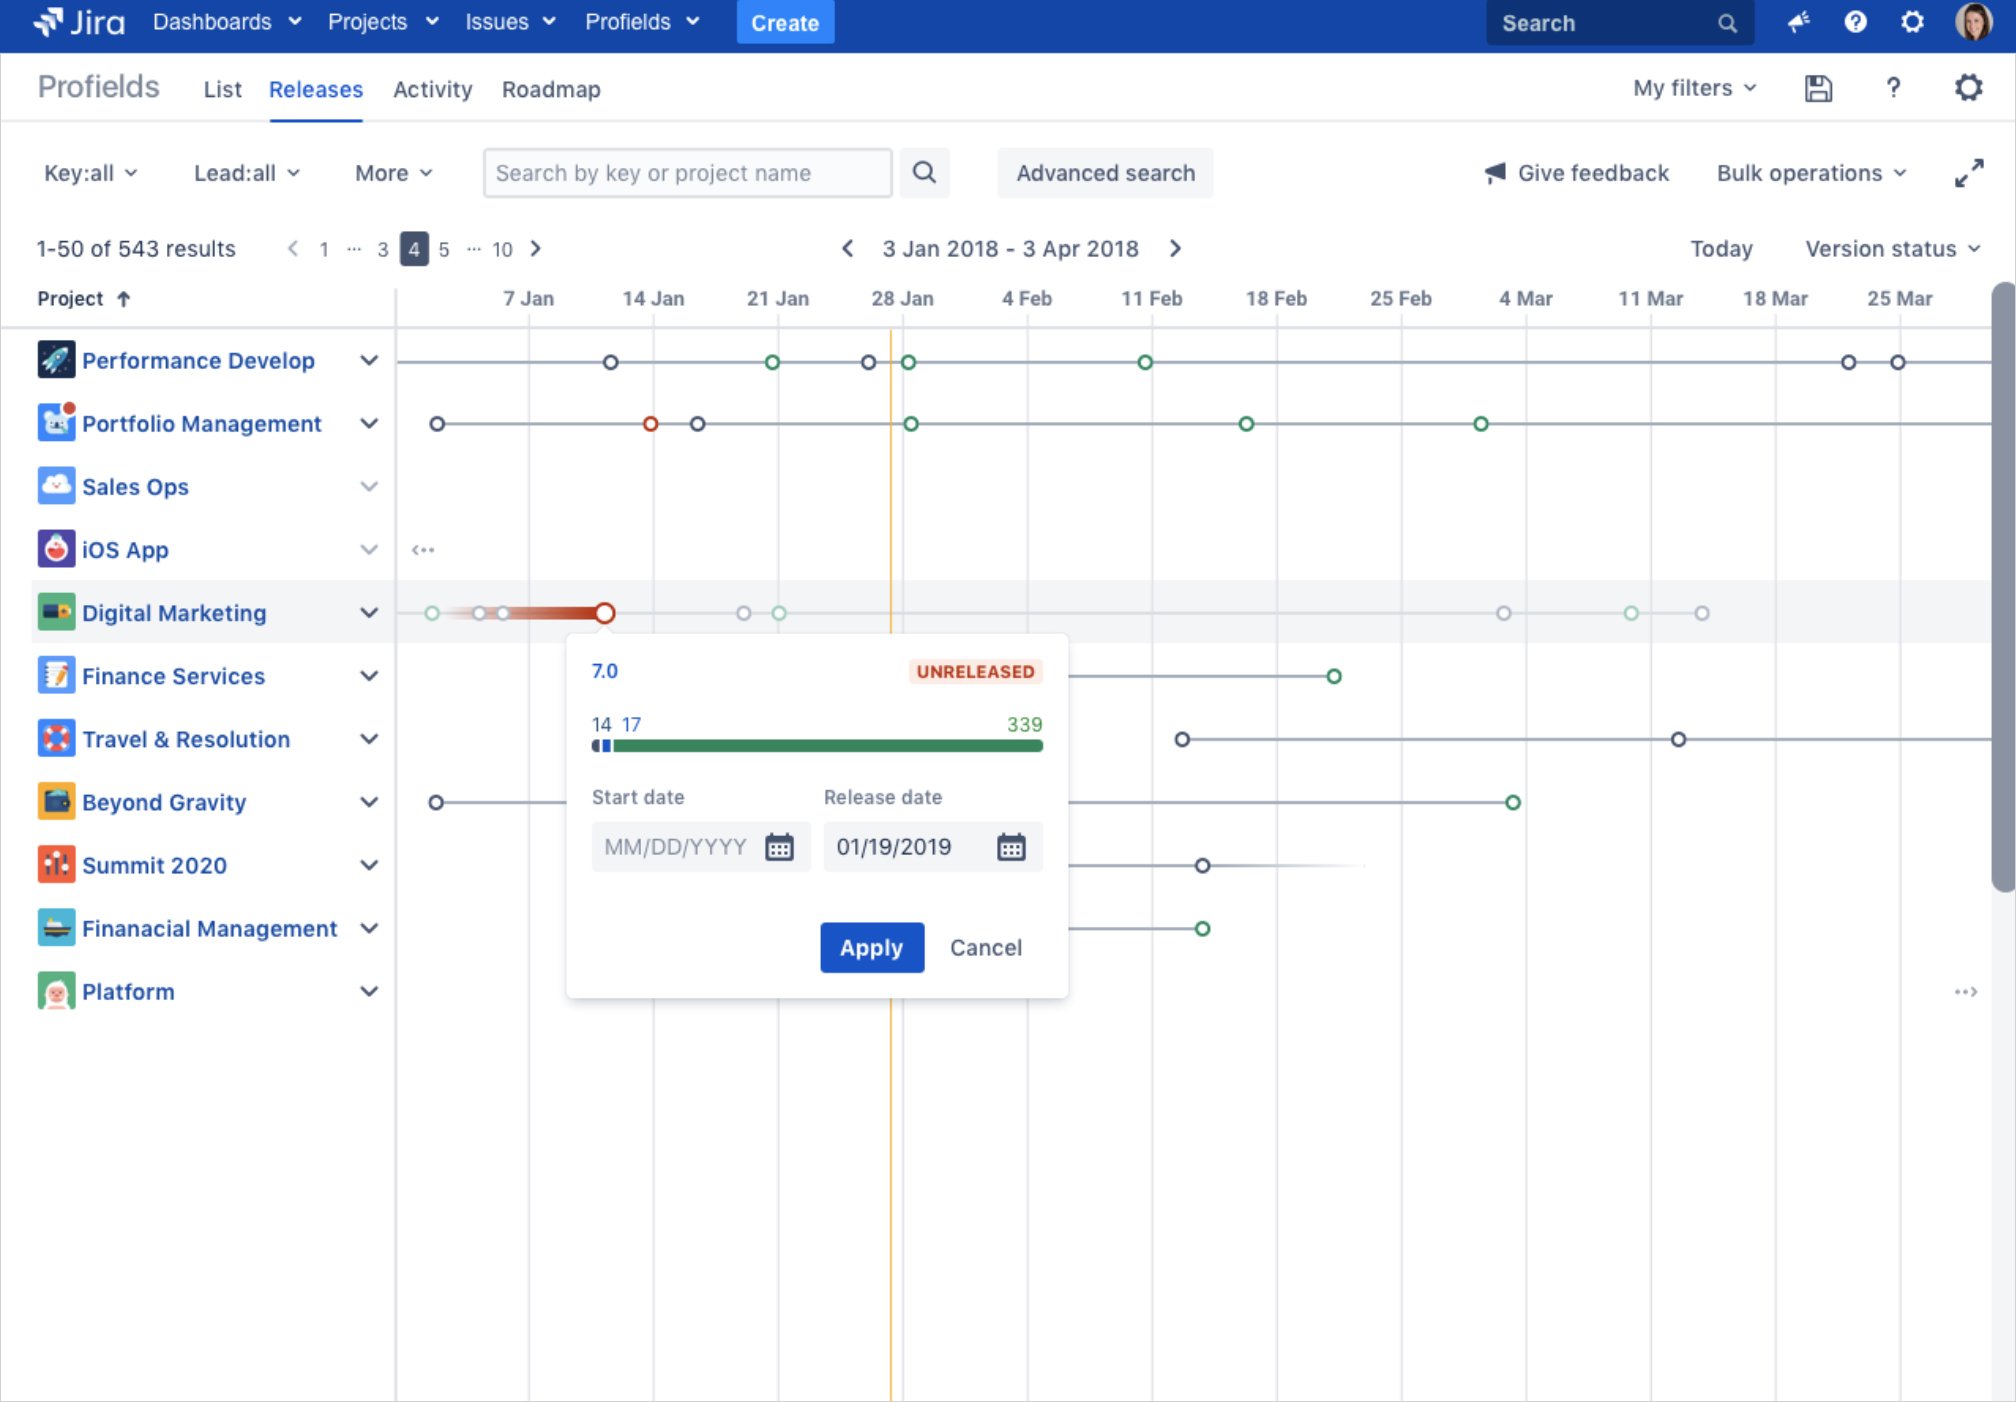
Platforms like Jira, Asana, and Trello are staples in our daily operations. They allow us to track tasks, assign story points, and monitor sprint progress in real time. Jira, for instance, offers detailed reporting on sprint velocity and cycle times. These tools are indispensable for maintaining transparency and accountability.
Consider our experience with Jira. By customizing dashboards, we can drill down into specific areas—like bottlenecks in the development cycle or unexpected spikes in bug reports. This granular visibility helps us pinpoint problems early and adjust our processes accordingly.
Code Repositories and Continuous Integration
GitHub, GitLab, and Bitbucket are more than just code repositories. They integrate seamlessly with continuous integration (CI) pipelines. Tools like Jenkins, CircleCI, and Travis CI enable automated testing, code quality checks, and deployment processes. Automated tests are key. They ensure that code changes don’t break existing functionality and maintain high-quality standards.

At 1985, we’ve integrated CI pipelines to run regression tests automatically. The benefit is clear: early detection of issues reduces the time spent on debugging later. This proactive approach has saved countless hours and significantly reduced our defect density.
Communication and Collaboration Platforms
Outsourced teams thrive on clear, consistent communication. Tools such as Slack, Microsoft Teams, and Zoom are vital. They provide a platform for daily stand-ups, brainstorming sessions, and real-time problem solving. The immediacy of these platforms keeps everyone aligned and fosters a culture of collaboration.
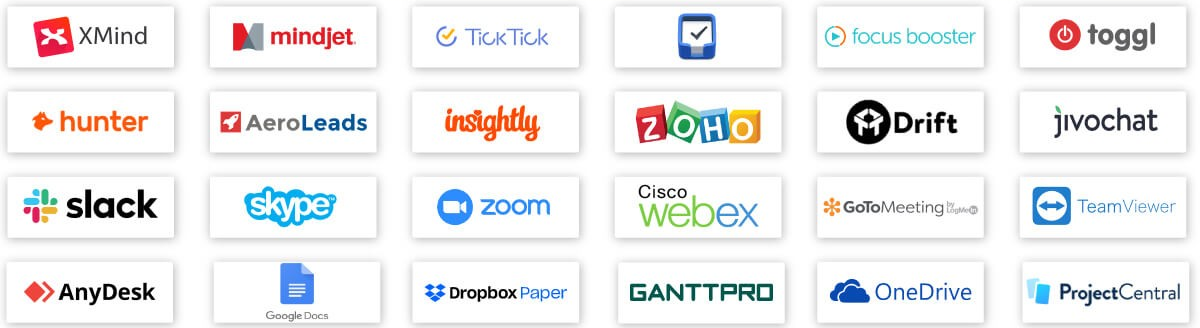
Even with asynchronous work environments, regular check-ins and clear communication channels help keep the team on track. Tools like Confluence help document decisions, coding guidelines, and meeting notes, ensuring that knowledge is preserved and accessible to everyone involved in the project.
Working with the Human Element
Metrics and tools are critical. But the human element in outsourced teams is equally important. Productivity isn’t solely defined by numbers—it’s also about the people behind those numbers.

Team Morale and Engagement
Happy teams are productive teams. Measuring team morale might seem abstract, but it’s essential. Regular surveys, one-on-one meetings, and open feedback channels help gauge the team’s sentiment. At 1985, we routinely check in with our teams. Their feedback is invaluable.
The data might not always show it. A developer might complete tasks at record speed, but if they’re stressed or disengaged, the long-term effects can be detrimental. High turnover rates, increased error rates, and lower innovation can all stem from a disengaged team. It’s important to create an environment where team members feel valued and heard.
Communication Efficiency
Effective communication is the glue that holds an outsourced team together. When measuring efficiency, consider not just the volume of communication but its quality. Are the messages clear? Are decisions made promptly? The frequency of misunderstandings can be a subtle yet powerful indicator of where processes may be improved.
At 1985, we track communication efficiency by monitoring response times and conducting periodic reviews of our internal communication protocols. Even a simple metric like “time to first response” in Slack can highlight gaps that need addressing.
Cultural and Time-Zone Differences
Outsourcing often involves cross-cultural teams. Different work cultures and time zones can impact productivity in nuanced ways. It’s crucial to understand these dynamics. For example, a team member in Eastern Europe might have a different working style than one in South Asia. Recognizing and accommodating these differences can improve collaboration and overall productivity.
One strategy we’ve employed is to schedule overlapping hours where possible. This ensures that real-time collaboration happens without delay. It might seem trivial, but such adjustments can make a significant difference in both morale and efficiency.

Analyzing Productivity: Case Studies and Data Points
Let’s get into specifics. Abstract metrics are useful, but real-world examples often provide the best insights. Here are some case studies and data points from our work at 1985 and industry insights from trusted sources.
Case Study: Improving Sprint Velocity
At one point, one of our outsourced teams was struggling with a stagnant sprint velocity. Their average velocity had plateaued at 25 story points per sprint for several months. We decided to re-evaluate their workflow. Through a series of iterative changes—refining sprint planning, enhancing backlog grooming sessions, and introducing mid-sprint reviews—we saw a measurable improvement. Within three months, their average velocity increased to 35 story points per sprint.
This 40% increase wasn’t just a number. It was the result of targeted interventions and a deep dive into the workflow. The changes fostered better collaboration, allowed for real-time course correction, and ultimately delivered more value to the client. This case reinforces that when you measure the right metrics and act on them, the impact is tangible.
Industry Data and Benchmarking
A study by McKinsey highlights that high-performing software teams have a defect density 30% lower than the industry average. In our experience, teams that maintain rigorous code reviews and integrate automated testing tend to achieve similar improvements.
Additionally, according to a report by Deloitte, teams that adopt agile methodologies and continuous integration practices can reduce cycle times by up to 50%. These numbers are not mere statistics; they are benchmarks we strive to meet and exceed at 1985. They serve as reminders that even in outsourcing, excellence is a measurable goal.
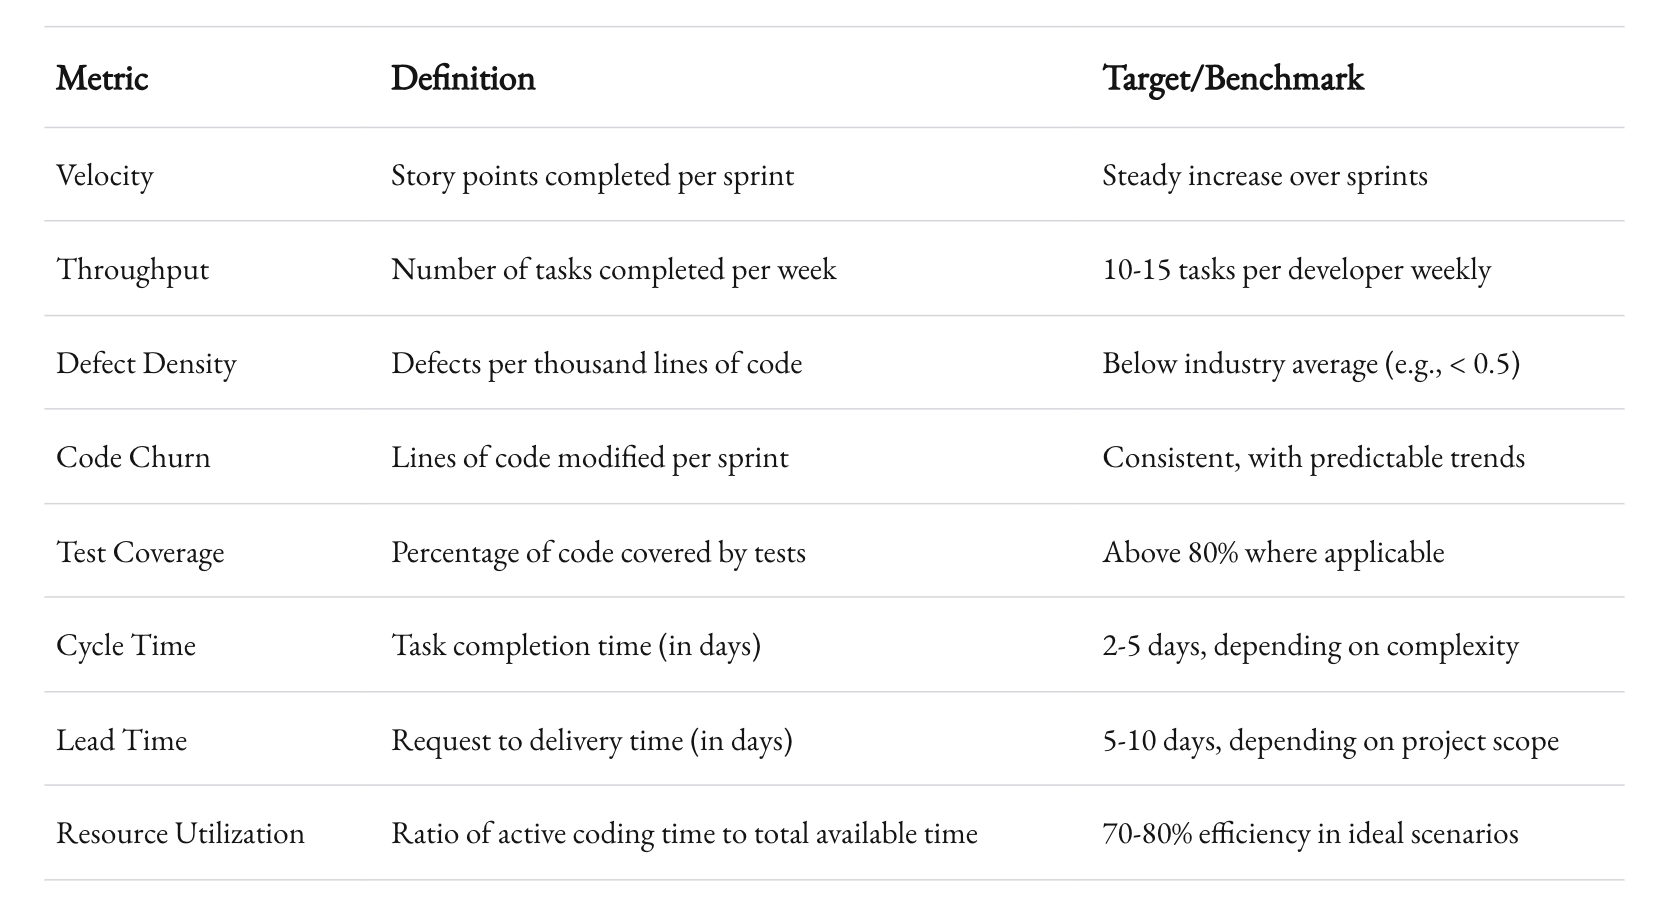
Below is a table summarizing top benchmarks for high-performing outsourced software development teams:
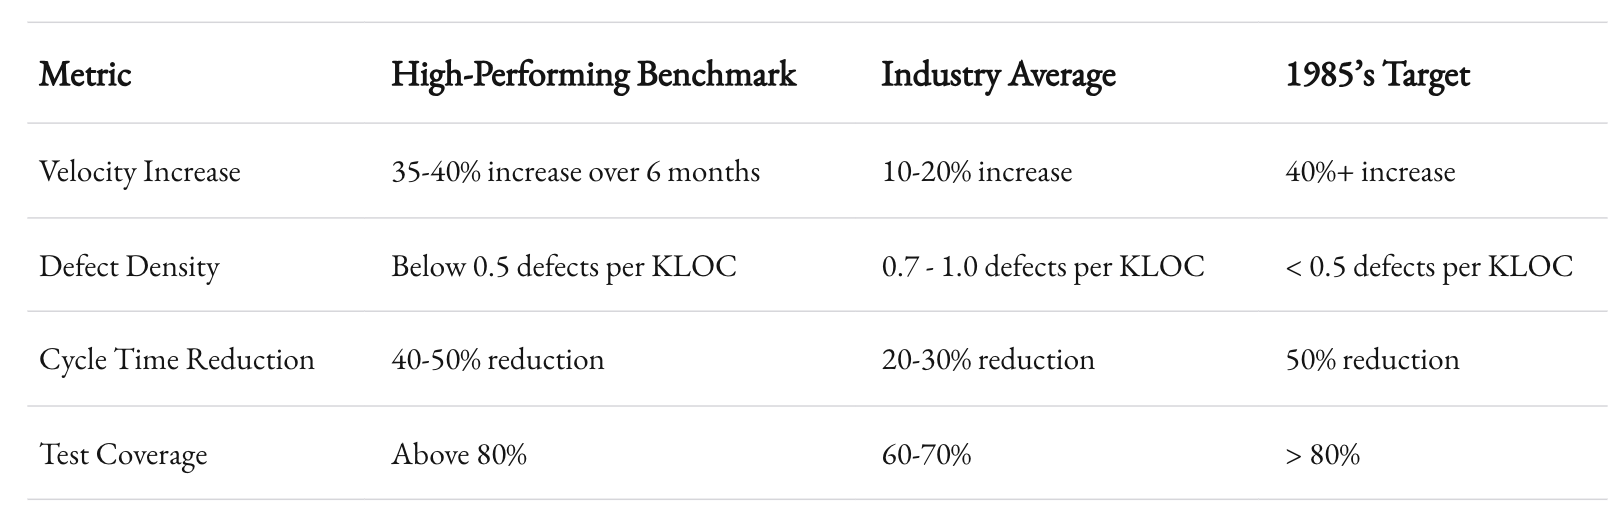
This table is a quick reference. It shows that high-performing teams are not just about speed—they’re about balance. Efficiency in code production, robust testing, and quick cycle times are all interconnected.

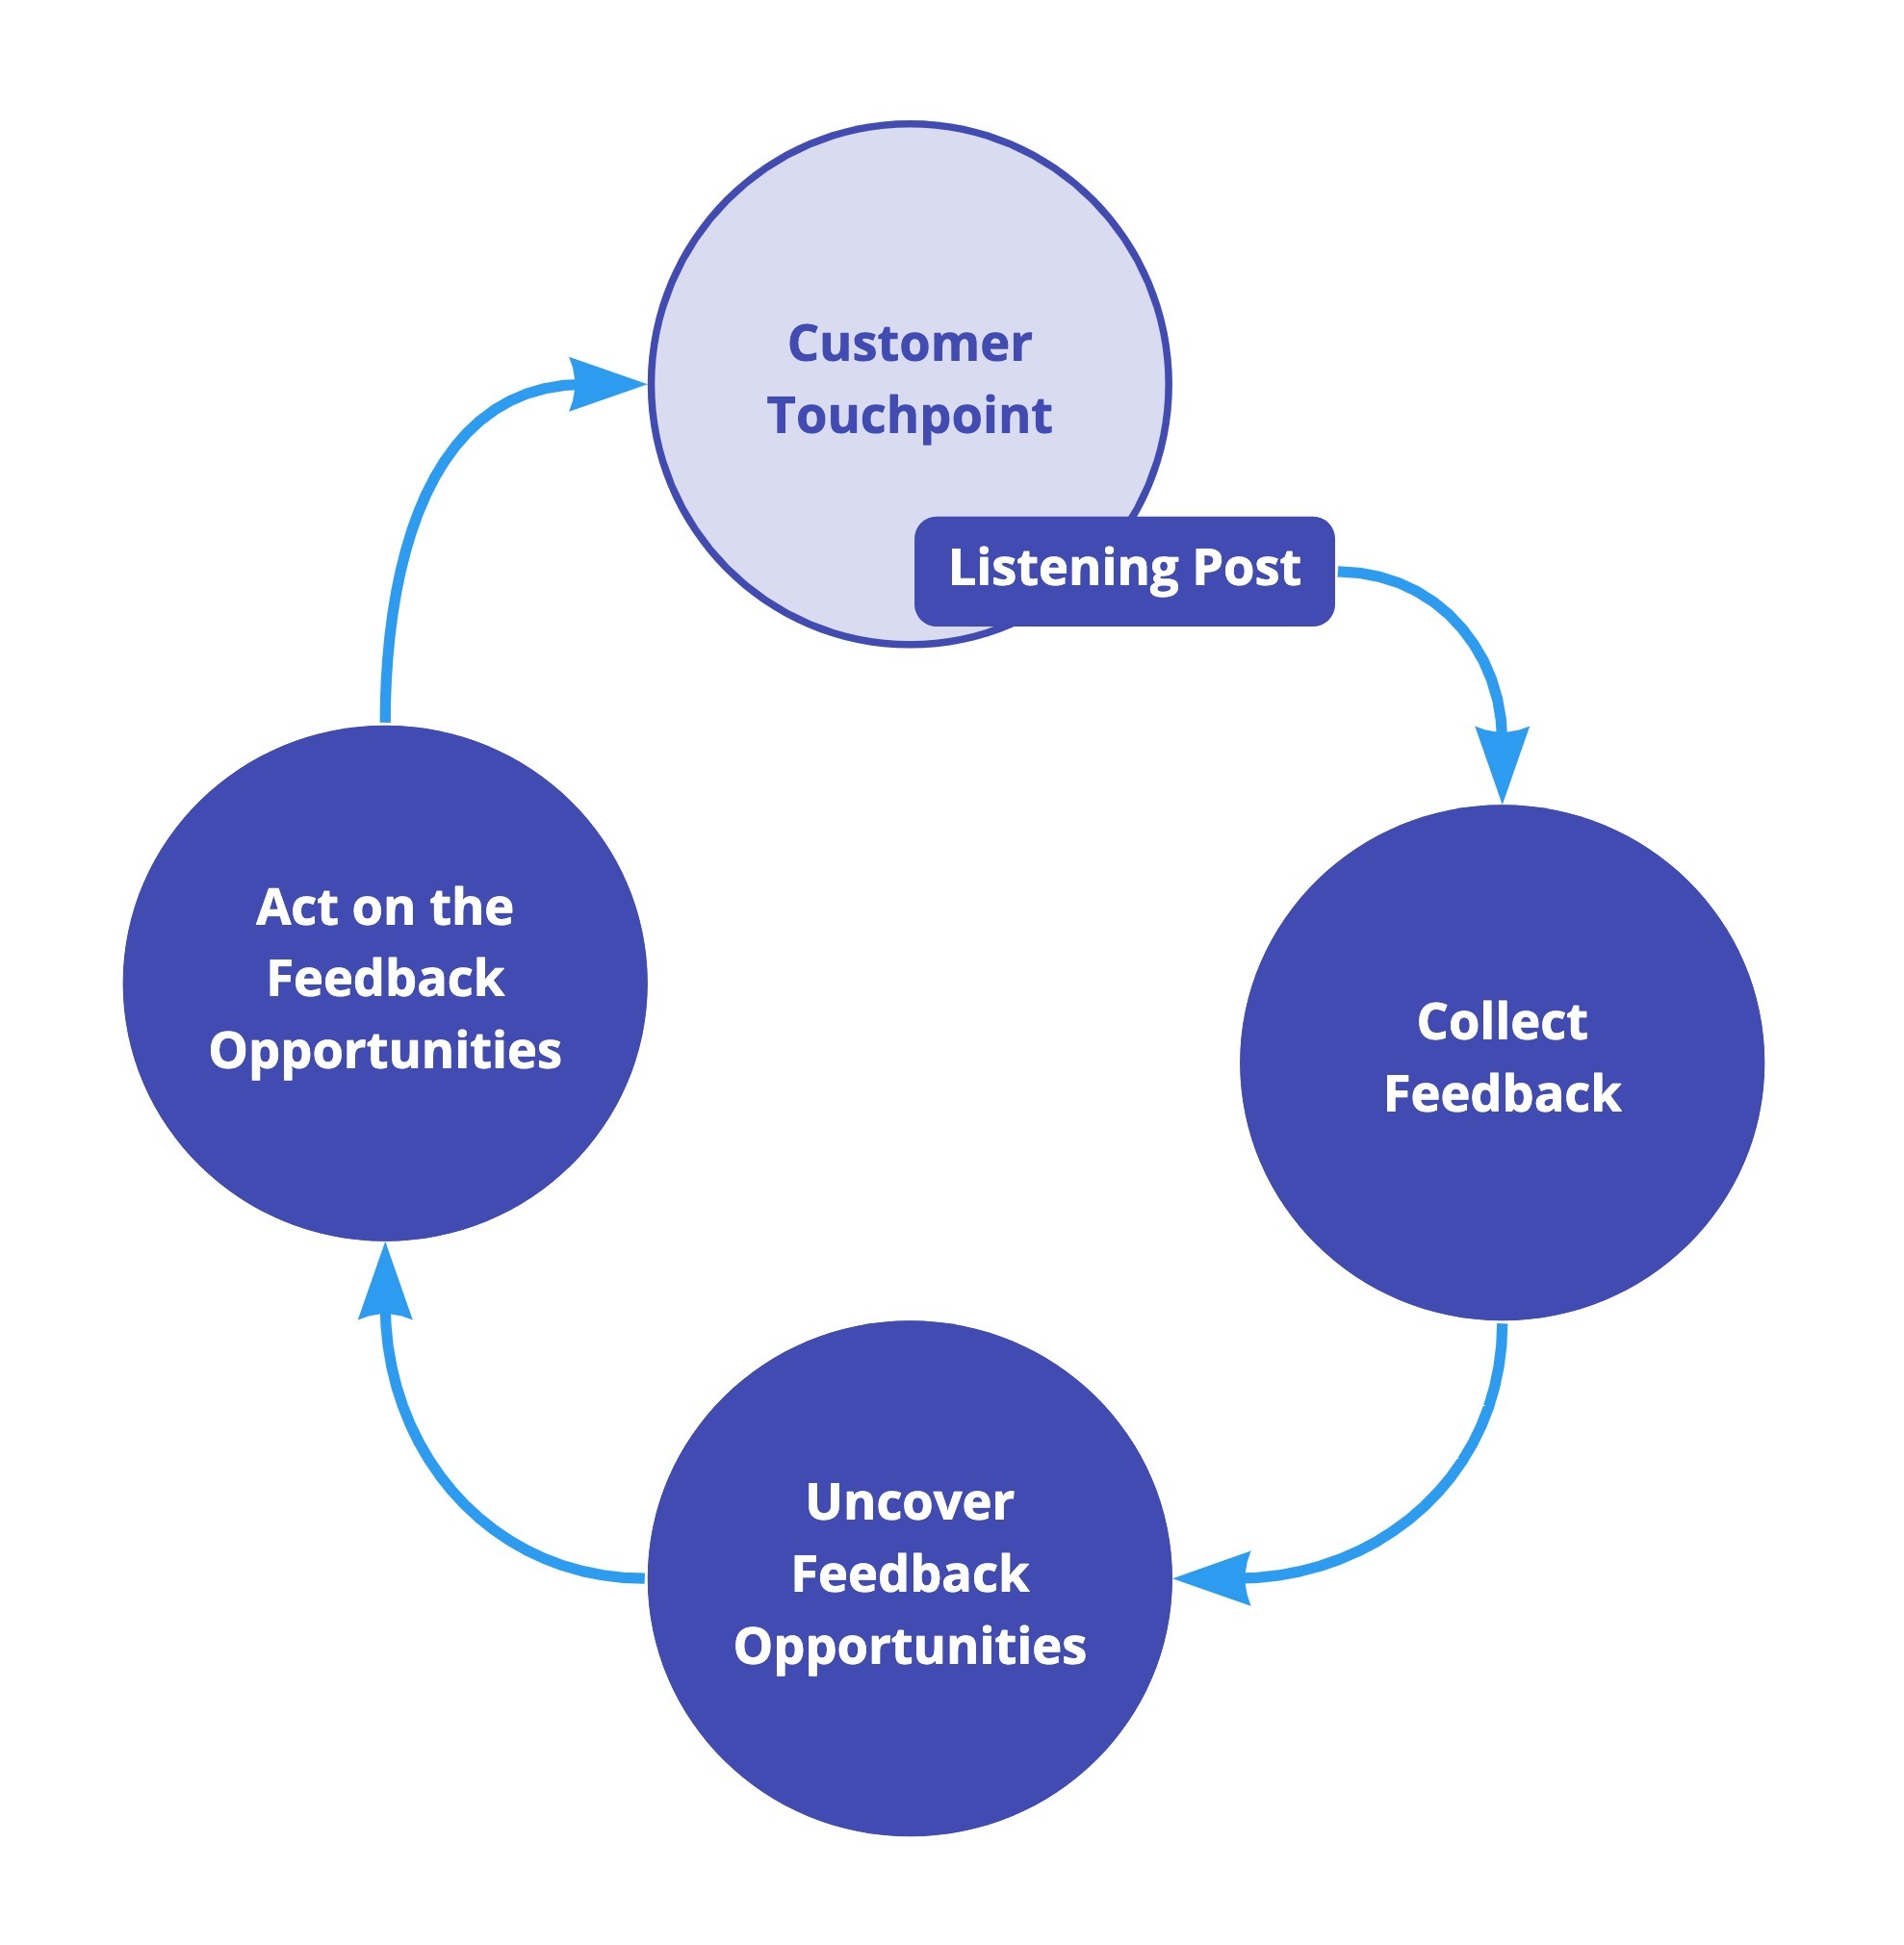
The Role of Continuous Feedback
Continuous feedback loops are integral to maintaining productivity. At 1985, we hold regular retrospectives. These meetings are more than just a formality. They are an opportunity to reflect on what went well, what didn’t, and how we can improve.
The data from these retrospectives often reveals trends. For example, if multiple developers mention that unclear requirements are causing delays, that’s a signal to refine our requirement-gathering process. Continuous feedback not only improves the current project but also sets a better foundation for future ones.
A quote from a senior developer on one of our teams encapsulates this sentiment:
"The best part of our process is the retrospective. It’s where we turn data into actionable insights. Without it, we’d be guessing about what to fix next."
This perspective is echoed across the industry. Continuous improvement is not just a buzzword—it’s a proven strategy for sustained success.
Beyond the Numbers: Balancing Quantitative and Qualitative Measures
Numbers are powerful. They tell a story. But not every story can be told with numbers alone. Measuring productivity in outsourced teams requires a balance between quantitative metrics and qualitative insights.
The Limitations of Purely Quantitative Data
Metrics like velocity, cycle time, and defect density are essential. However, they can sometimes miss the context. For example, an increase in cycle time might not necessarily indicate inefficiency. It could be a sign of tackling more complex tasks or integrating more rigorous quality checks.
In our practice at 1985, we have learned that a spike in bug reports might reflect a deeper issue—a misalignment in requirements or a need for additional training—rather than outright poor performance. Relying solely on numbers can lead to misinterpretations. That’s why it’s vital to complement these metrics with qualitative data.
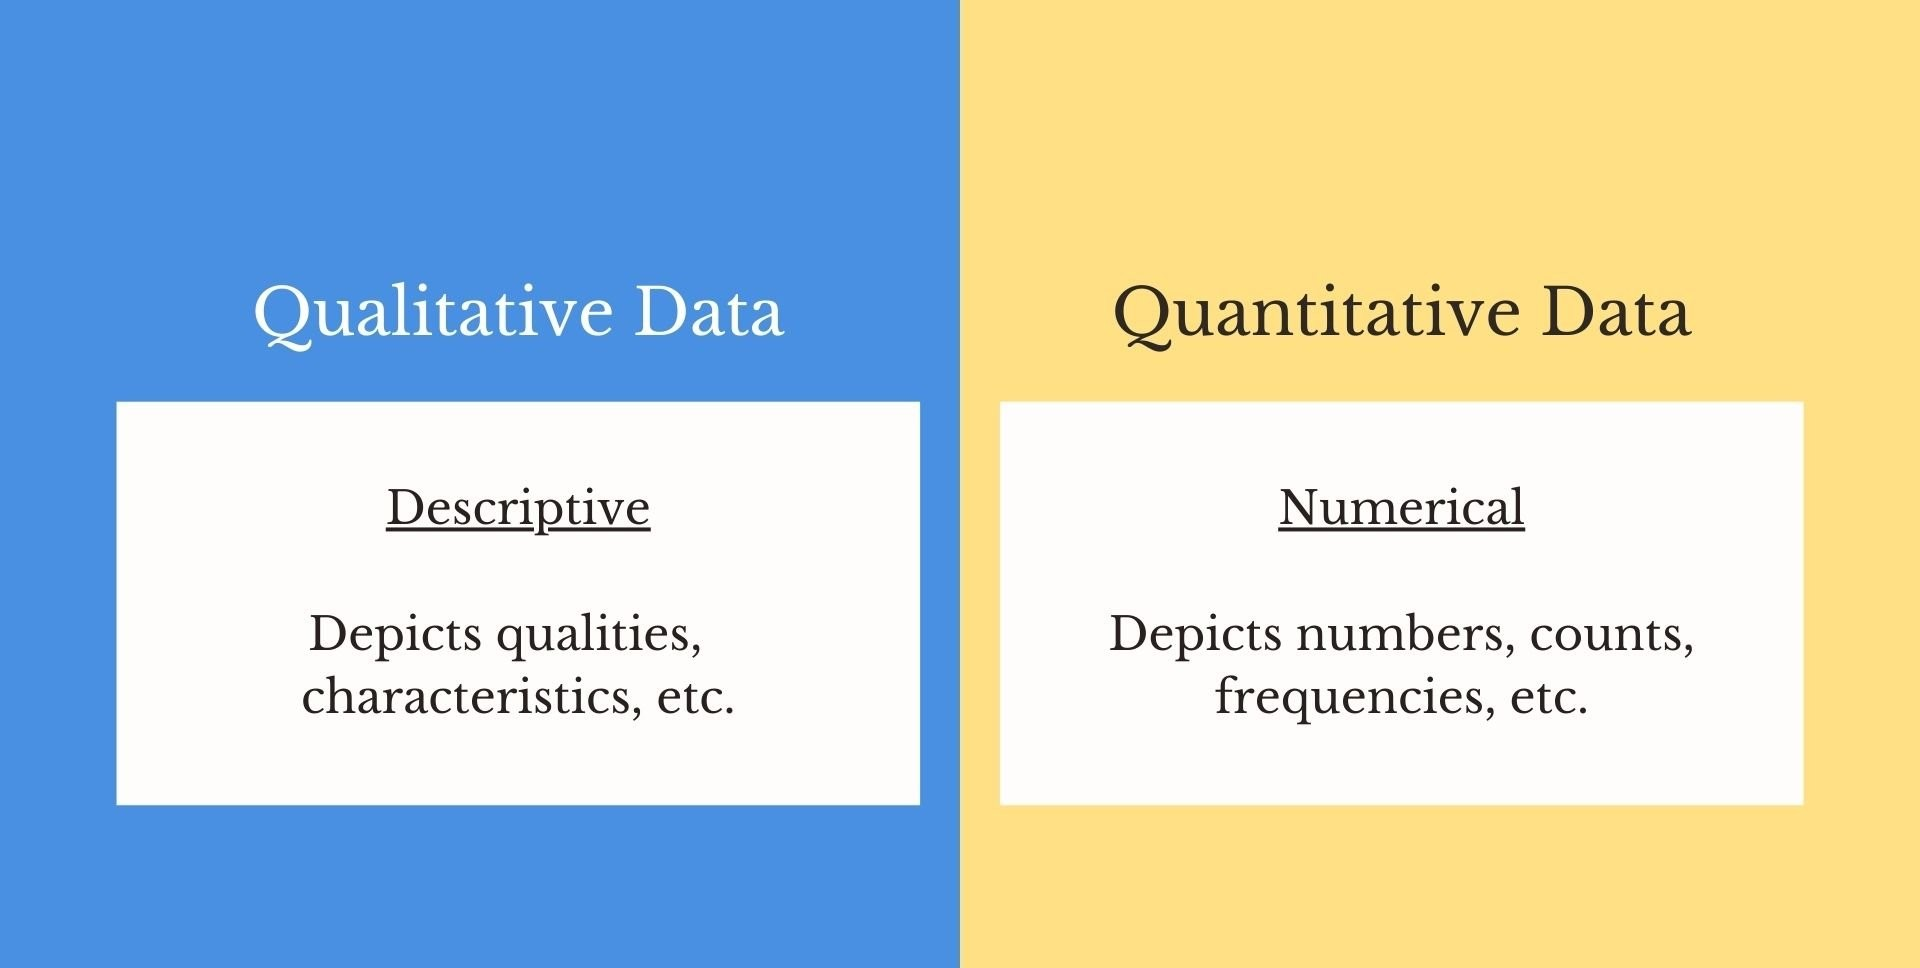
The Value of Qualitative Insights
Qualitative insights come from team surveys, one-on-one interviews, and even informal feedback. These insights reveal the nuances that numbers cannot capture. They help identify underlying issues such as burnout, communication gaps, or unclear expectations.
For instance, while quantitative data might show a stable velocity, qualitative feedback might indicate that the team is feeling overworked or that there is a communication breakdown with the client. Addressing these issues early can prevent long-term productivity losses.
Consider this scenario: Our outsourced team was meeting sprint goals consistently. The numbers were good. However, feedback revealed that the developers felt disconnected from the project vision. Once we organized a series of virtual team-building sessions and increased the frequency of strategic update meetings, morale improved, and eventually, so did the quality of the code. It’s a reminder that while metrics are essential, the human side of the equation is equally critical.
Implementing Best Practices for Measurement
Measuring productivity isn’t a one-off task—it’s an ongoing process. It requires continuous adjustments and a willingness to adapt based on new data. Here are some best practices we follow at 1985.
Establish Clear Objectives
Before you can measure productivity, you must define what success looks like. This means setting clear, specific objectives for each project. Objectives should be tied to both the client’s goals and the team’s development milestones.
When objectives are clear, every metric gains context. For example, a sprint’s velocity becomes meaningful when you know that the goal was to deliver a new feature with specific requirements. Without clear objectives, even the best metrics can be misleading.
Integrate Feedback Mechanisms
Incorporate regular feedback loops into your process. This includes both formal and informal methods. Formal methods could be scheduled retrospectives, while informal methods might include quick daily check-ins via chat or video calls.
At 1985, we use a blend of these methods. A simple weekly survey can reveal trends before they become significant issues. Immediate feedback helps us address minor hiccups before they affect the overall project.
Use a Balanced Scorecard
A balanced scorecard approach can be invaluable. It allows you to look at multiple dimensions of productivity simultaneously. This approach goes beyond simple metrics to include aspects like innovation, customer satisfaction, and team engagement.
The balanced scorecard can be customized to suit your organization’s specific needs. For outsourced teams, it might include categories like communication efficiency, adherence to agile practices, and even cultural integration. A holistic view of performance often yields better insights than any single metric could.
Below is an example of a balanced scorecard tailored for outsourced software development teams:
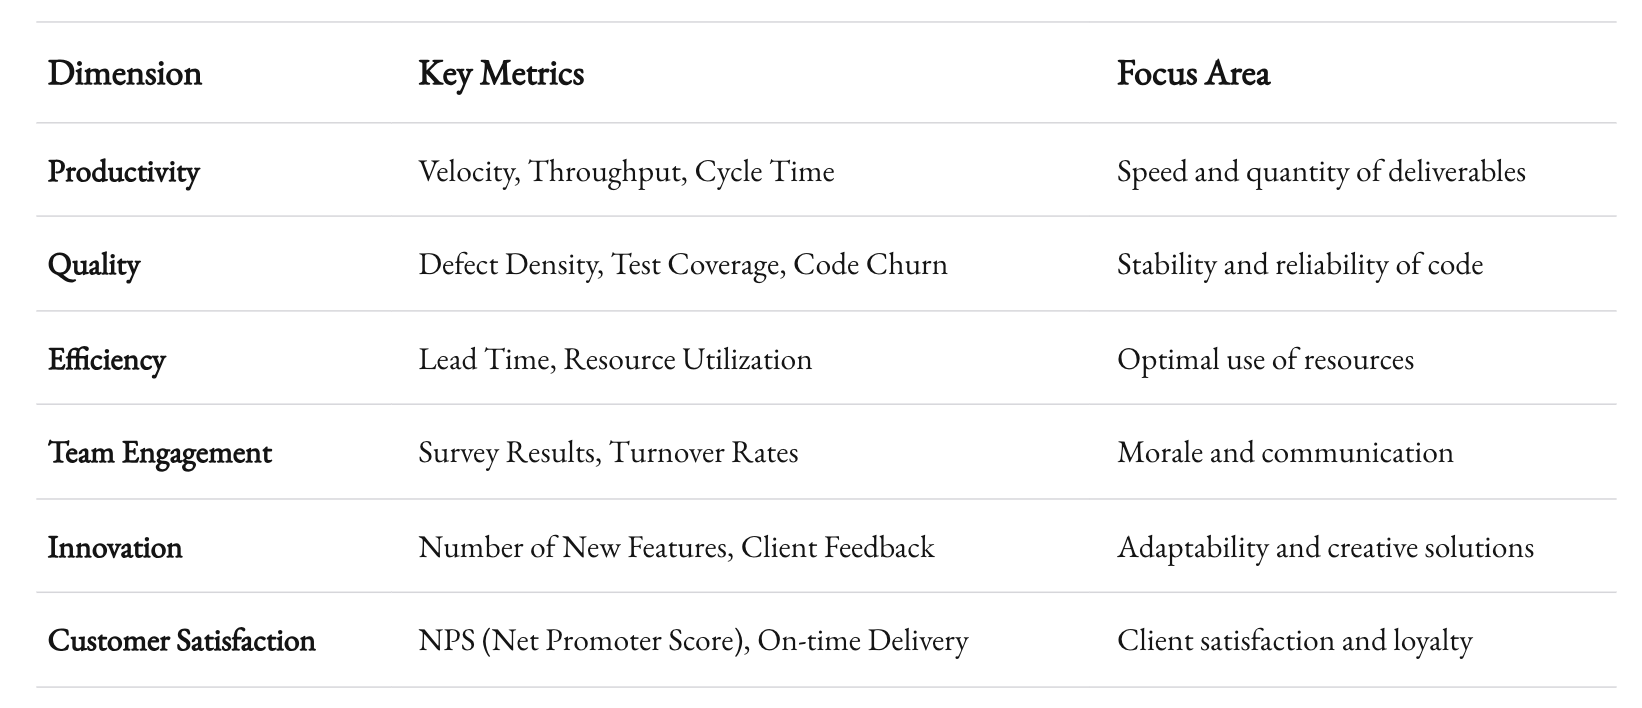
This balanced scorecard isn’t just a management tool. It’s a conversation starter. It helps align the team’s day-to-day tasks with the overarching goals of the project.
Use Technology and Automation
Automation can dramatically improve both measurement and productivity. With tools like Jenkins for continuous integration and Jira for project tracking, you can automate data collection. This minimizes human error and ensures that the data is accurate and up-to-date.
Automation also frees up time. Instead of manually tracking every metric, your team can focus on what they do best—developing great software. The key is to integrate these tools into your workflow in a way that they complement, rather than complicate, the process.
Regularly Review and Adapt
Finally, the world of outsourced software development is dynamic. What works today might not work tomorrow. That’s why it’s crucial to regularly review your metrics and adjust your strategies.
At 1985, we have a quarterly review process. Every quarter, we analyze our data, assess our processes, and make adjustments where needed. It’s a continuous improvement cycle. It ensures that we’re not just maintaining our standards but constantly pushing for better performance.
Industry-Specific Nuances: What Outsourcing Teaches Us
Outsourcing software development is unique. It brings together diverse teams, cultures, and technologies. This diversity is its strength but also its challenge. Here are some nuanced insights from the industry.

Managing Across Time Zones
Time zones can be a barrier. They can delay communication, slow down decision-making, and create overlaps in working hours. Yet, they can also be an advantage. When managed correctly, they allow for a “follow-the-sun” model. Work continues around the clock, reducing downtime and speeding up delivery.
At 1985, we strategically schedule overlapping hours. We invest in time management tools that automatically adjust for time differences. Our data shows that with proper scheduling, teams can reduce cycle times by 15–20%. This approach requires careful planning and continuous monitoring, but the benefits are well worth it.

Cultural Differences and Communication Styles
Different cultures have different ways of communicating and collaborating. What is considered a polite pause in one culture might be seen as hesitation in another. Understanding these nuances is critical for smooth operations.
We invest in cultural training for our managers and team leads. This training helps in bridging communication gaps and building a cohesive team environment. When team members understand and appreciate their cultural differences, collaboration improves and misunderstandings decrease. This human-centric approach, combined with solid metrics, creates a balanced environment where productivity thrives.
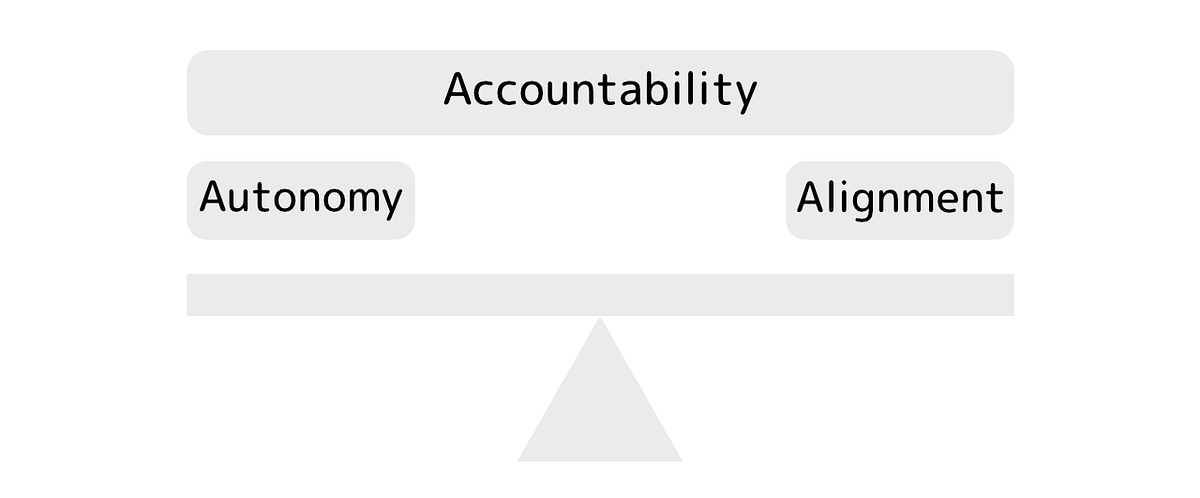
Balancing Autonomy and Accountability
One of the biggest challenges in managing outsourced teams is finding the right balance between autonomy and accountability. On one hand, autonomy fosters innovation and empowers developers. On the other hand, accountability ensures that projects stay on track and meet deadlines.
We address this balance through a clear set of expectations and robust reporting mechanisms. Developers are given the freedom to explore and innovate within defined boundaries. Regular check-ins and transparent reporting ensure that this autonomy does not turn into a lack of accountability. This balance is reflected in both the qualitative and quantitative metrics we track.
The Impact of Agile Practices
Agile isn’t just a methodology—it’s a culture. Agile practices empower teams to self-organize and adapt quickly to changes. However, measuring the effectiveness of agile practices requires more than just looking at sprint velocities.
At 1985, we focus on agile maturity models. These models assess how well a team is adopting agile principles such as continuous integration, regular retrospectives, and iterative planning. Studies suggest that high-performing agile teams reduce project delivery times by up to 30% compared to traditional waterfall teams. This data reinforces our commitment to agile practices as a cornerstone of our measurement strategy.
Common Pitfalls and How to Avoid Them
Even with the best metrics and tools, there are pitfalls that can derail your measurement efforts. Understanding these pitfalls is crucial for maintaining accuracy and trust in your data.
Over-Reliance on a Single Metric
Focusing solely on one metric, such as velocity, can lead to skewed perceptions of productivity. When teams feel pressured to hit high velocity numbers, quality might suffer. This is why it’s important to maintain a balanced scorecard.
At 1985, we’ve learned that a holistic approach is the only way to get an accurate picture. A drop in velocity might be acceptable if quality metrics are high. Conversely, a spike in throughput is meaningless if it comes at the cost of increased defects. Always look at the full spectrum of metrics.

Ignoring Contextual Factors
Numbers don’t exist in a vacuum. External factors—such as changes in project scope, unforeseen technical challenges, or even global events—can impact your metrics. It’s essential to understand the context behind the numbers.
For example, during a period of rapid client changes, cycle times may naturally increase. In such cases, it’s important to communicate the context to stakeholders. Contextualizing metrics helps prevent misunderstandings and builds trust between teams and clients.
Failing to Evolve with the Team
The nature of software development is ever-changing. What worked for one project might not work for another. Failing to adapt your metrics and processes to new challenges can lead to stagnation.
Regularly revisiting and updating your measurement strategy is not optional—it’s a necessity. At 1985, we schedule strategy sessions to review our metrics framework. This proactive approach ensures that our measurement practices evolve with our teams and the industry.
Looking Ahead: Future Trends in Productivity Measurement
The landscape of software development continues to evolve. New tools, methodologies, and best practices emerge regularly. Staying ahead means embracing innovation in how we measure productivity.
Integration of AI and Machine Learning
Artificial Intelligence (AI) and Machine Learning (ML) are set to transform productivity measurement. Predictive analytics can forecast project delays, flag potential quality issues, and even suggest resource reallocations before problems become critical.
Imagine a dashboard that not only displays current metrics but also provides predictive insights. This isn’t a futuristic idea—it’s already happening in some cutting-edge firms. At 1985, we’re exploring AI-driven tools that analyze code commits, review patterns, and even developer sentiment. These tools can offer insights that traditional metrics might miss, leading to more proactive management.

Enhanced Collaboration Platforms
As remote work continues to grow, collaboration platforms will become even more sophisticated. We expect future tools to integrate virtual reality (VR) elements, immersive meeting spaces, and enhanced real-time translation features. Such innovations will break down language barriers and make cross-cultural teams even more effective.
These platforms will also likely incorporate more granular data collection, providing even deeper insights into team dynamics. The key will be balancing technology with the human touch—ensuring that while we capture data, we also foster genuine collaboration and engagement.

Greater Emphasis on Well-being Metrics
The future of productivity measurement will likely include a stronger focus on well-being. As companies recognize that sustainable productivity is rooted in employee satisfaction and health, metrics will expand to include factors like stress levels, work-life balance, and overall job satisfaction.
At 1985, we’re already integrating well-being surveys into our regular check-ins. The goal is not only to measure output but to ensure that our teams remain healthy, happy, and creative. This holistic approach is essential for long-term success and innovation.
Final Thoughts
Measuring the productivity and efficiency of outsourced teams is no small feat. It requires a blend of quantitative metrics, qualitative insights, and a deep understanding of the human elements that drive performance. At 1985, we have seen firsthand that the best results come from a balanced approach—one that values data without losing sight of the people behind it.
We must be agile in our methods, flexible in our thinking, and committed to continuous improvement. The metrics we track are not just numbers; they are indicators of our ability to adapt, innovate, and succeed. They tell a story of progress, challenge, and ultimately, achievement.
Every project, every sprint, and every team member contributes to a larger narrative. That narrative is one of growth, learning, and shared success. As we look to the future, the integration of new technologies and the continuous refinement of our processes will only make our measurement strategies more robust and insightful.
In the end, productivity is not an end in itself. It is a means to create quality software, foster innovation, and build lasting partnerships. Whether you manage one outsourced team or a network of teams across continents, the principles remain the same. Measure what matters, adapt when needed, and always keep the human element in focus.
Our approach at 1985:
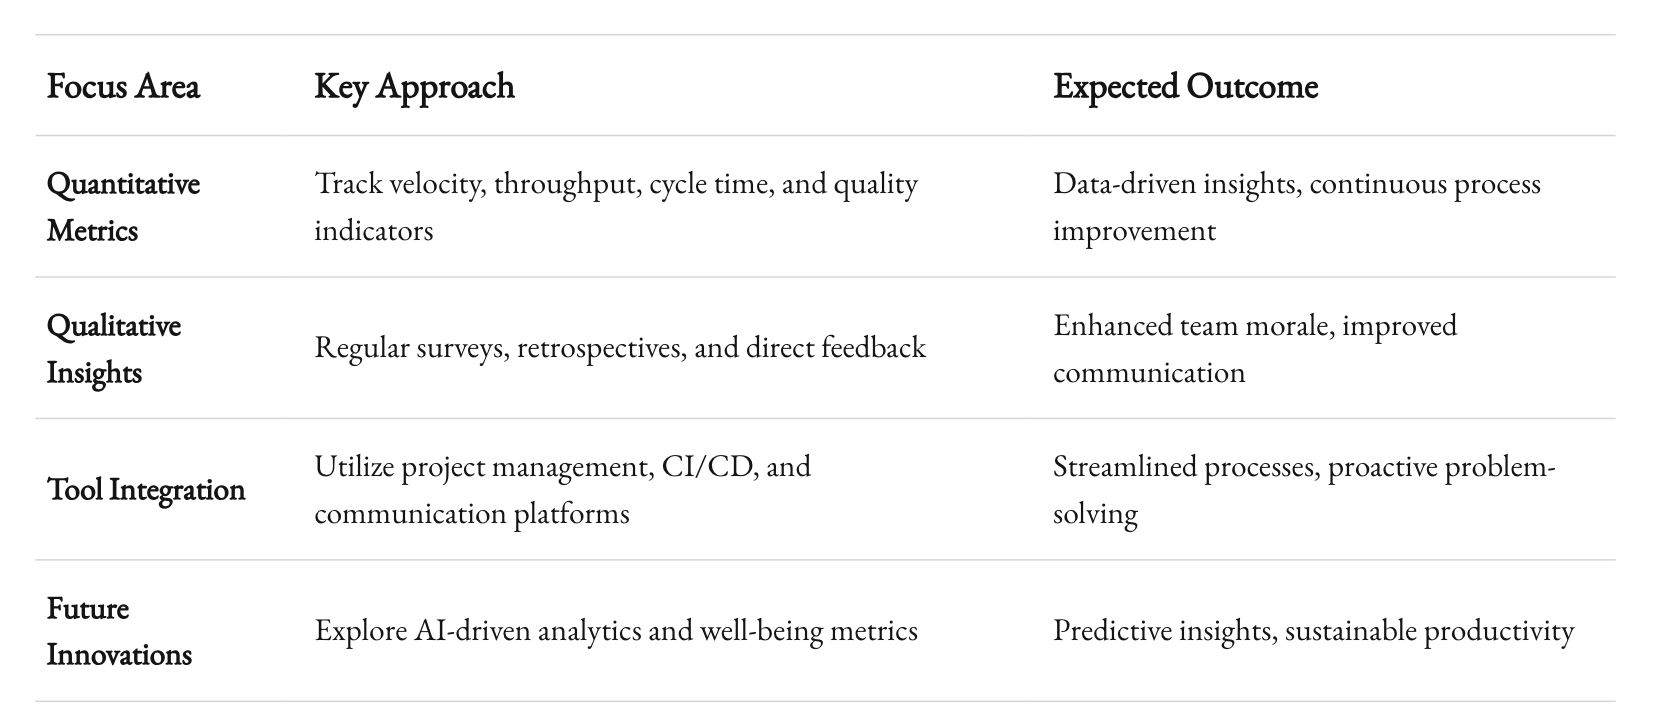
As we continue on this journey, remember that each metric is a tool. A tool to help us understand, improve, and ultimately succeed in a rapidly evolving industry. Outsourced teams are not just remote workers—they are integral parts of a dynamic, global ecosystem of innovation.
Thank you for taking the time to explore this topic with me. I hope you found this deep dive both informative and reflective of the challenges and opportunities in our industry. Let’s keep the conversation going. Share your experiences, insights, and challenges in the comments below. Together, we can redefine what productivity means in the world of outsourced software development.


