Mastering Logging and Monitoring: Best Practices from 1985
Discover how precise logging and smart monitoring can boost your system’s resilience and efficiency.

I run an Outsourced Software Development company called 1985. Over the years, I've seen how a well-implemented logging and monitoring strategy can be the difference between a minor hiccup and a full-blown outage. In our fast-paced world, where every second of downtime can cost you dearly, knowing the ins and outs of effective logging and monitoring isn't just a luxury—it’s essential.
When I first started diving into the world of logging, I was overwhelmed. There were so many tools, so many strategies, and so many conflicting opinions. Over time, I learned that the magic lies in balancing simplicity with depth. Short, punchy log messages can be as valuable as the complex metrics that inform your decision-making. It’s all about knowing your environment and designing your logging strategy to meet its unique challenges.
This blog post is a deep dive into the best practices for implementing effective logging and monitoring. We’ll cover everything from the subtleties of log aggregation to the nuances of selecting the right tools. My goal is to offer you insights that go beyond the basics. You’ll learn industry-specific, pinpointed techniques that we use at 1985 to keep our systems running smoothly. Let’s roll up our sleeves and get into the nitty-gritty.
Why Logging and Monitoring Matter
Logging and monitoring are the unsung heroes of modern software systems. They provide the eyes and ears that keep your digital world in check.
The Impact on Business Operations
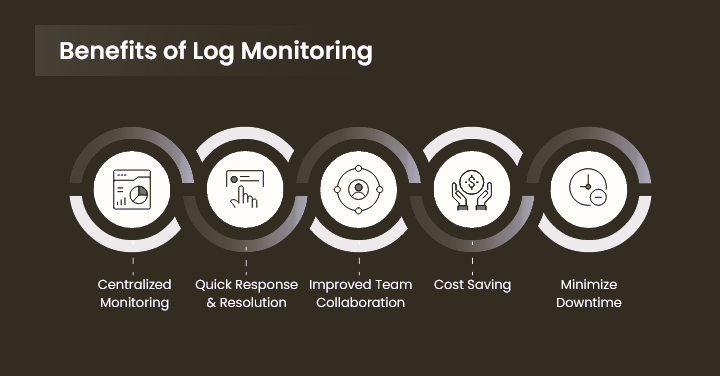
In our industry, time is money. Downtime not only disrupts operations but also tarnishes your brand reputation. Imagine your critical application going down for even a few minutes. Customers are frustrated, revenue takes a hit, and your team scrambles to figure out what went wrong. Effective logging provides the clues needed to diagnose issues quickly. Meanwhile, robust monitoring turns those clues into actionable insights. This isn’t just theory—it’s a matter of survival in a competitive market.
Logging and monitoring help you detect anomalies before they become disasters. They give you a window into the health of your applications. With a proper strategy, you can reduce the mean time to resolution (MTTR) significantly. Research indicates that companies with effective monitoring and logging practices reduce downtime by as much as 50% compared to those that rely on reactive measures. That’s not just a number—it’s a competitive edge.
At 1985, our clients trust us because we know that every log entry and every metric tells a story. We use these stories to craft strategies that not only fix problems but also preempt them. When systems run seamlessly, customers remain happy, and businesses grow. This is why logging and monitoring are so critical in our work.
The Technical Backbone
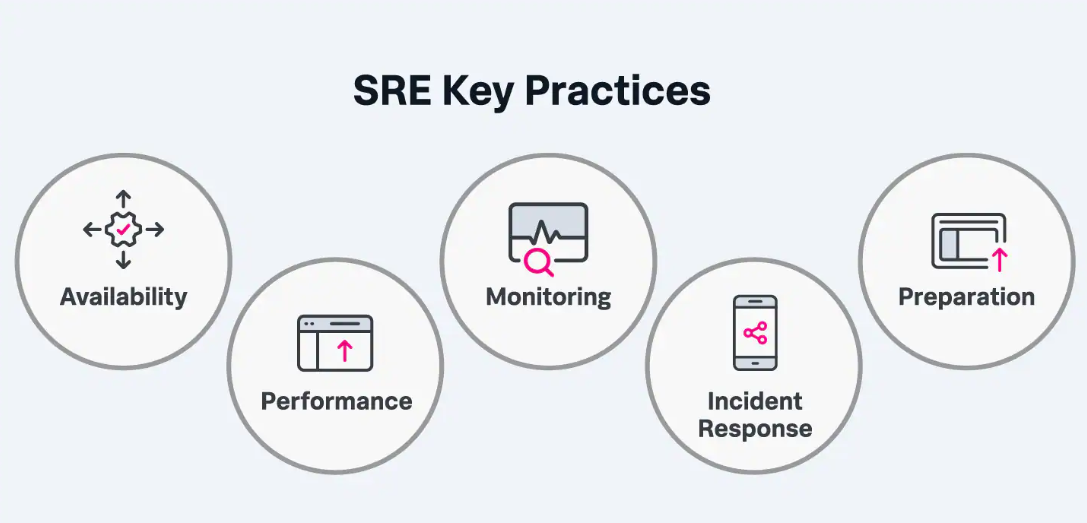
Logging isn’t about dumping a mountain of data into a file. It’s about precision. It’s about capturing the right information at the right time. Effective logs are structured, contextual, and actionable. They allow engineers to pinpoint issues without wading through irrelevant details.
Monitoring, on the other hand, is about continuously observing the state of your systems. It’s proactive. It’s about setting up alerts and dashboards that tell you when something is amiss. A good monitoring setup doesn’t just notify you of a problem—it provides insights into why the problem occurred. It’s like having a seasoned detective on your team, always on the lookout for clues.
Combining these two practices creates a safety net for your systems. Logging gives you the historical data needed to perform root cause analysis, while monitoring keeps you informed in real-time. The synergy between these practices is what makes them indispensable in modern software engineering.
Setting Up Your Logging Infrastructure
Designing a robust logging infrastructure isn’t just about slapping together a few tools. It’s about building an ecosystem that works in harmony. At 1985, we’ve learned a few hard-earned lessons along the way.
Structured Logging: Clarity Over Chaos
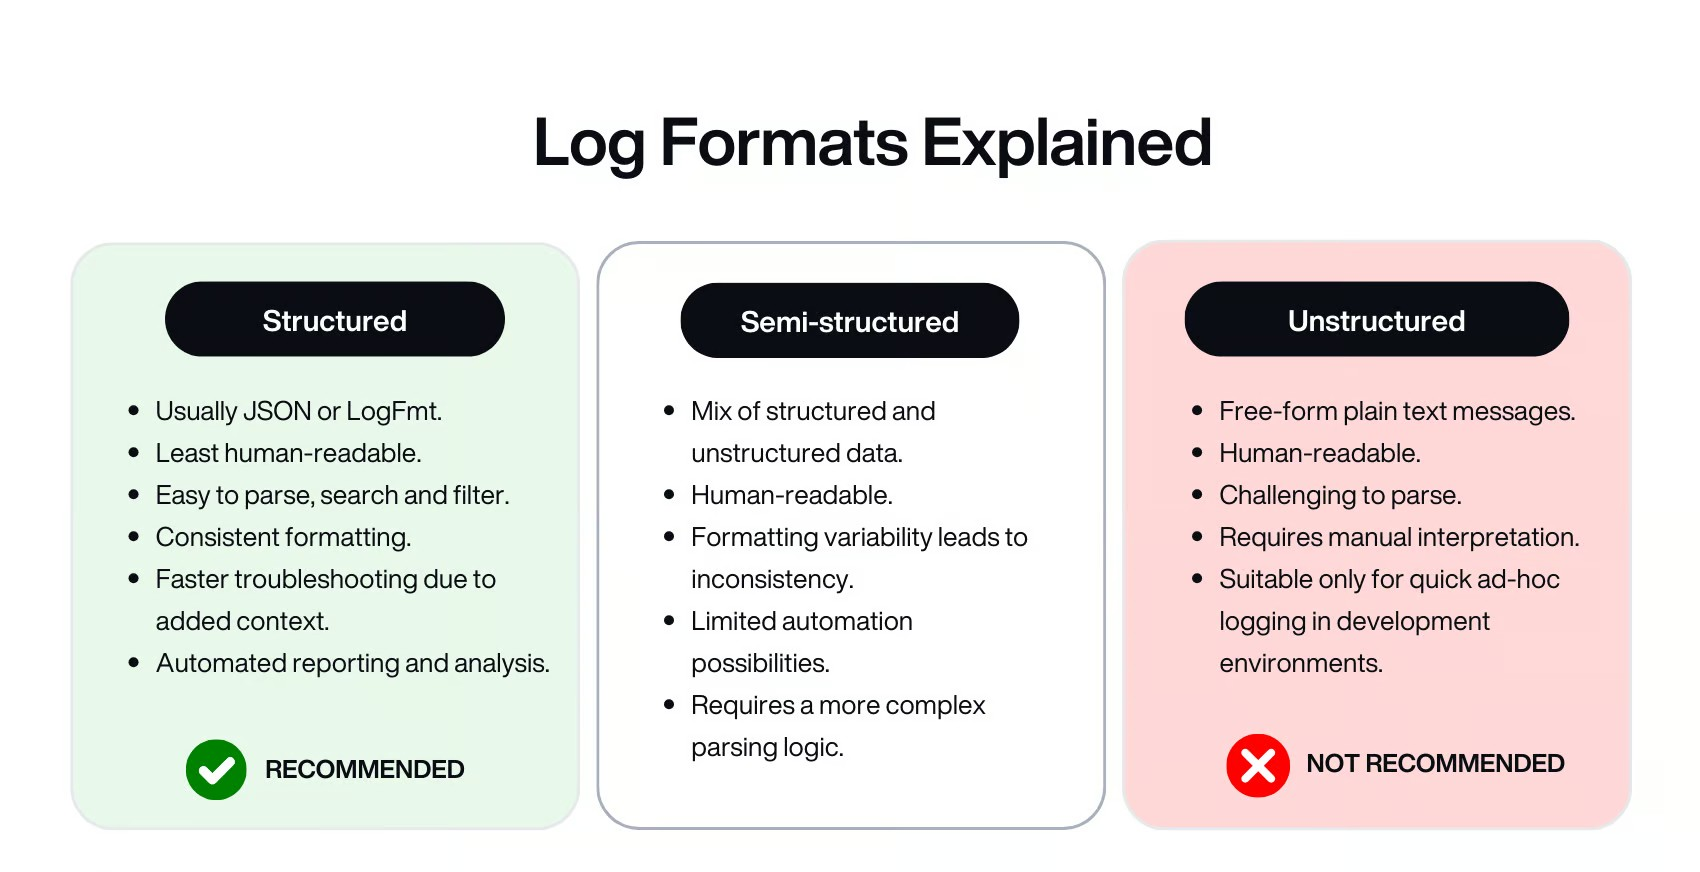
Logs should be more than just random strings of text. They should be structured. Structured logging means that every log entry is formatted in a consistent way. This consistency is what allows you to search, filter, and analyze logs effectively.
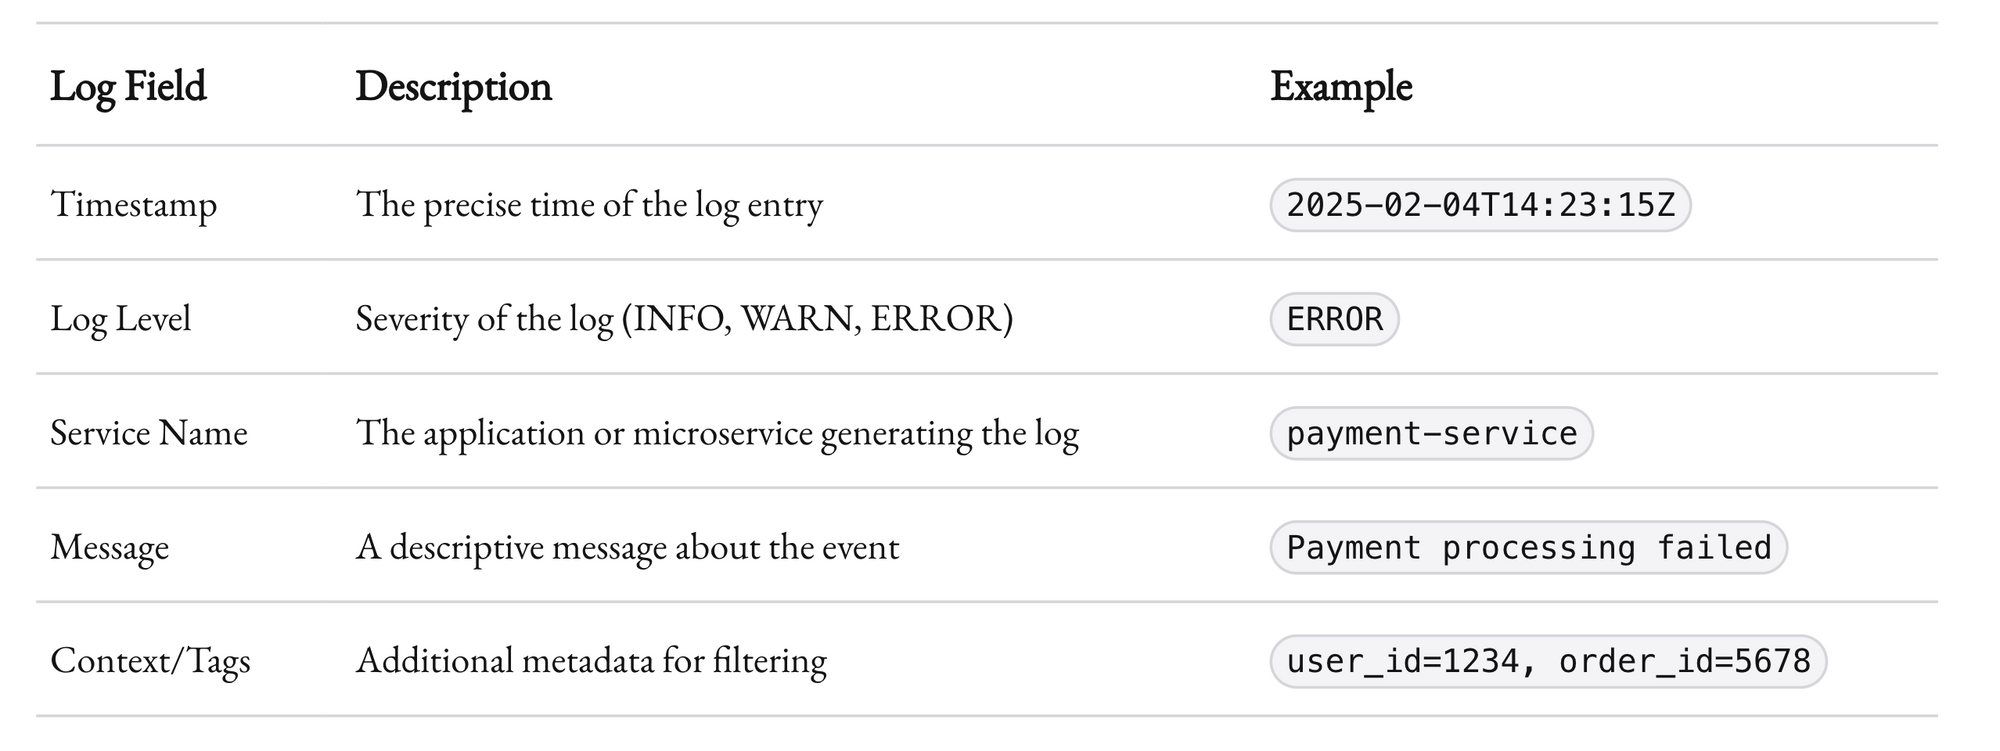
Structured logs help break down complex events into digestible pieces. They’re not just a record; they’re a tool for analysis. When you structure your logs correctly, you can leverage powerful tools to search and analyze them, leading to faster issue resolution and better insights.
A single error in production can generate thousands of log entries. Without structure, sifting through them would be like searching for a needle in a haystack. With structure, you can filter out the noise and focus on what matters.
At 1985, we’ve standardized our logging practices across all our projects. This standardization has been a game changer. It ensures that no matter which project or service you’re looking at, the logs speak the same language. This consistency is invaluable when diagnosing cross-service issues in a microservices architecture.
Centralized Logging Systems
A critical step in building an effective logging infrastructure is centralization. When your logs are spread out across multiple servers or environments, it becomes nearly impossible to get a unified view of your system’s health.
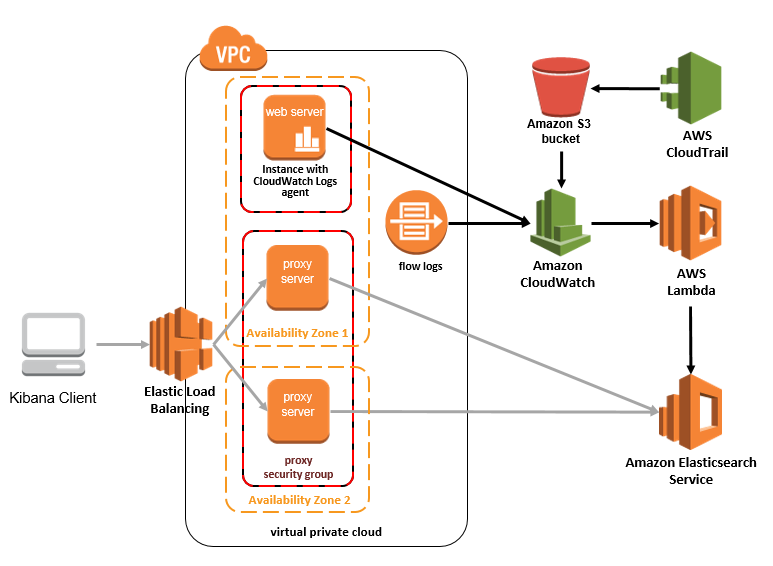
Centralized logging systems, such as the ELK stack (Elasticsearch, Logstash, Kibana) or Splunk, collect logs from various sources and store them in a single, searchable repository. This setup allows you to perform queries across all your logs, making it easier to detect patterns, anomalies, and issues that span multiple services.
At 1985, we use centralized logging extensively. It allows our engineers to perform root cause analysis swiftly. Instead of logging into multiple servers and piecing together information manually, they can simply query our centralized system and get a holistic view of the problem.
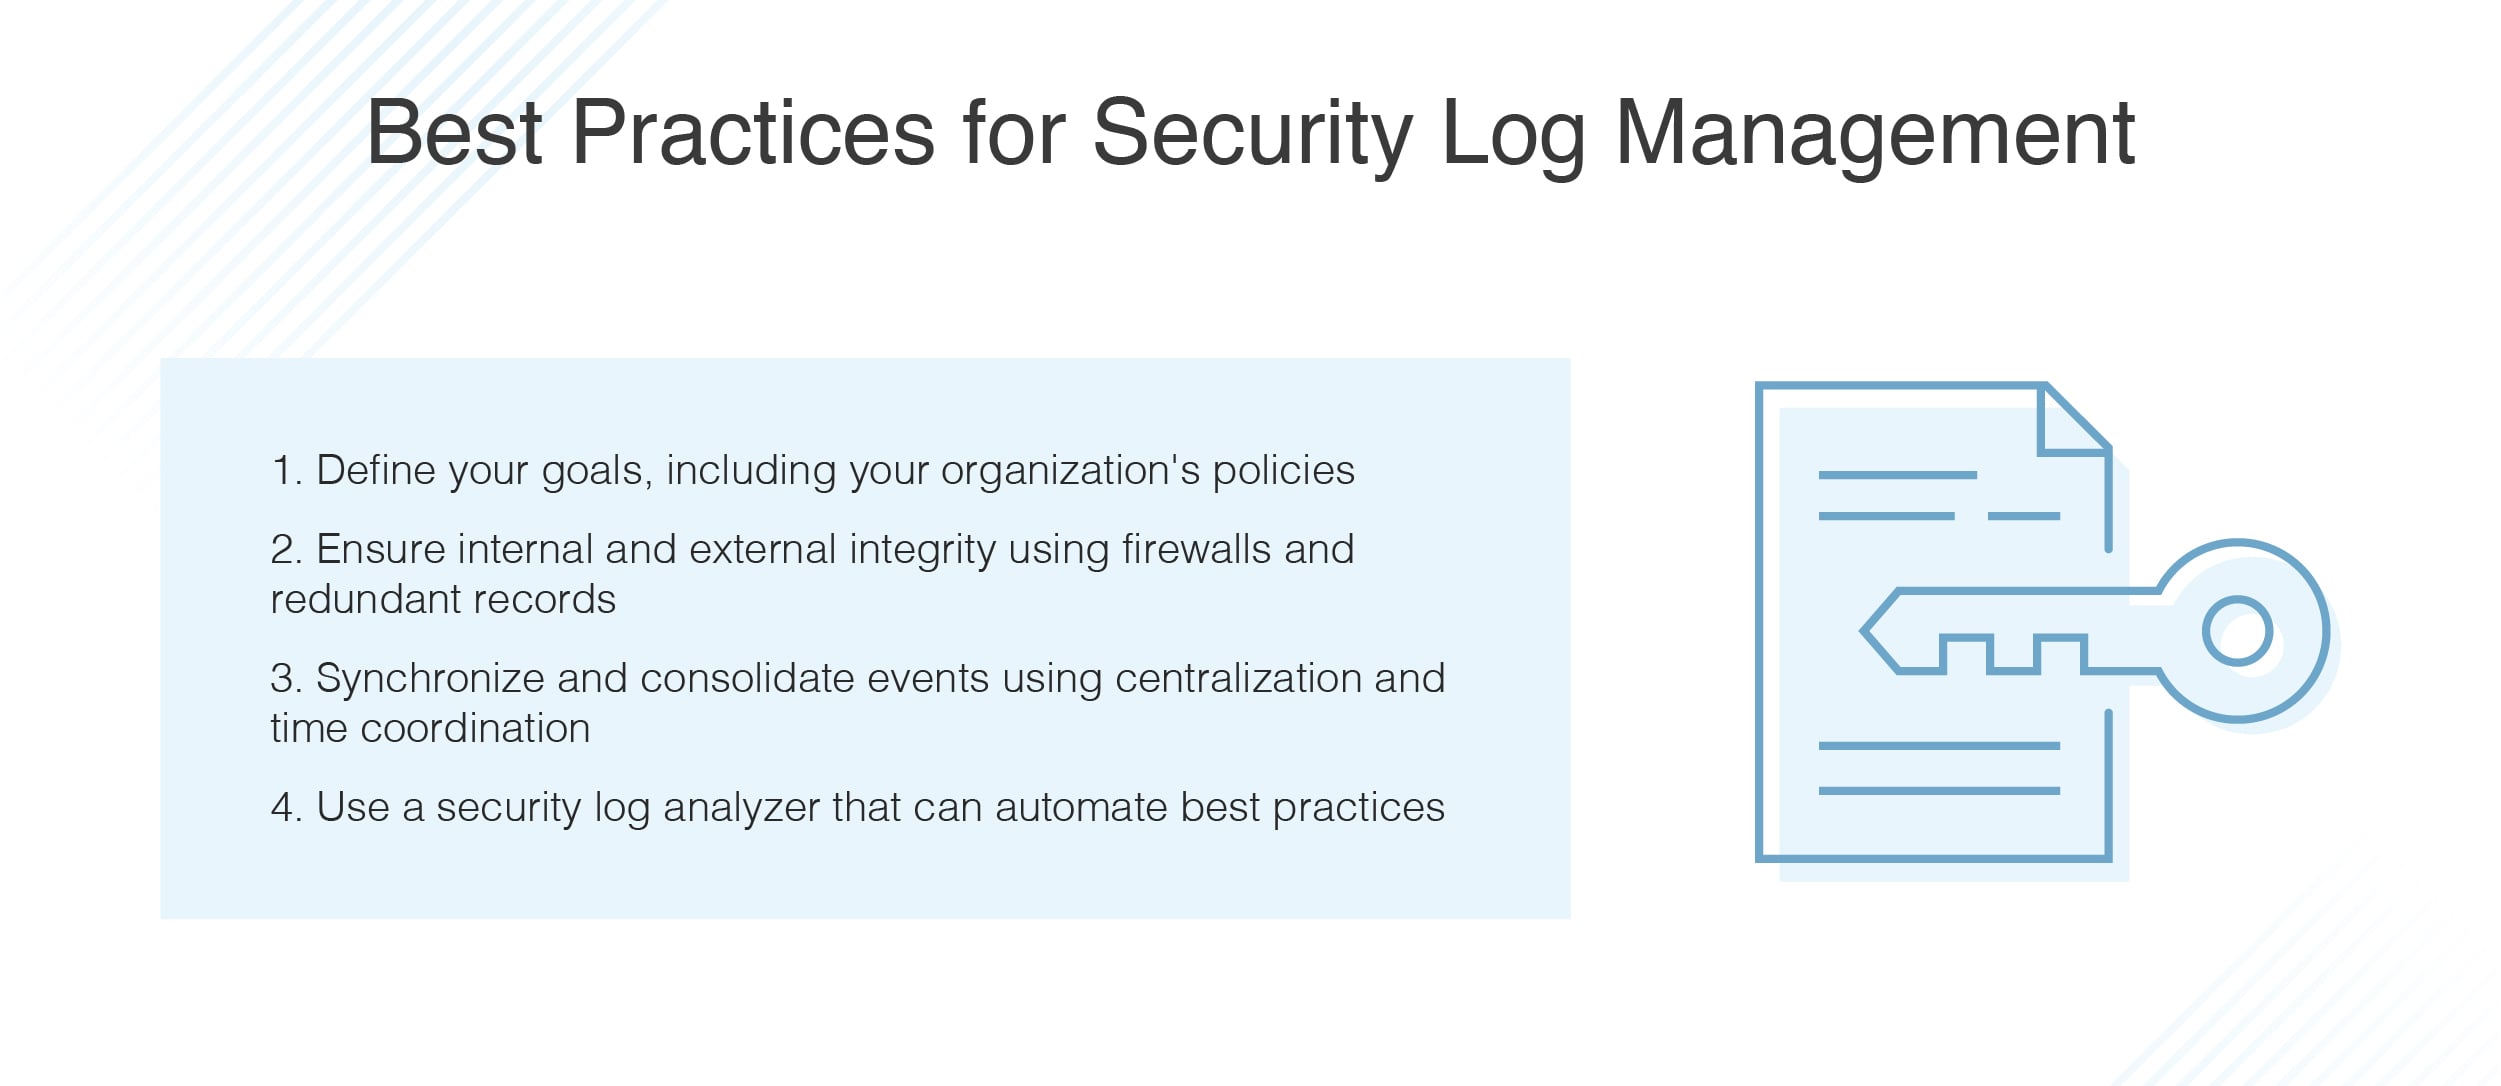
There’s also an undeniable benefit in having a centralized system for compliance and auditing. Many industries require detailed logs for regulatory purposes. Centralized logging ensures that you’re prepared for audits and can demonstrate a clear history of system behavior.
Best Practices for Log Retention and Rotation
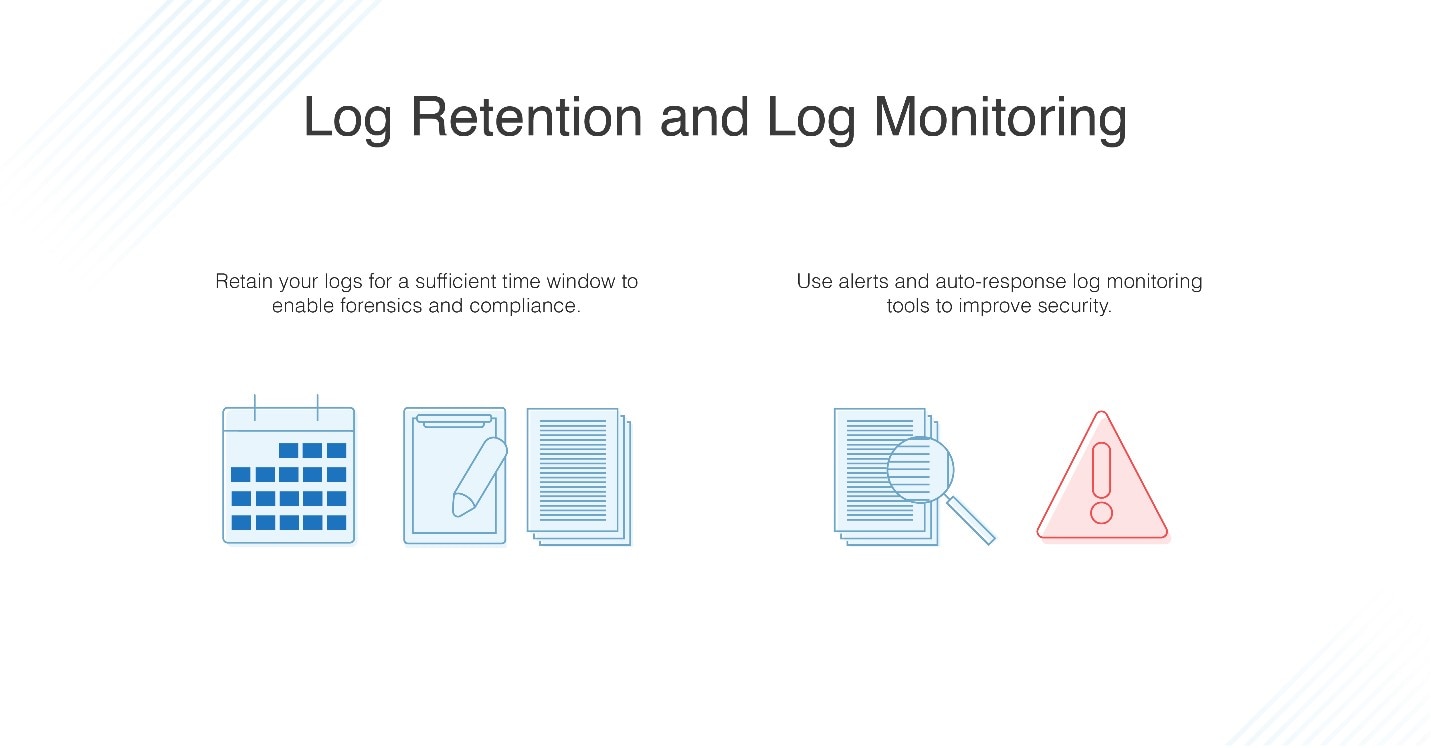
Logs can grow rapidly. Without a clear retention policy, your systems can become bogged down with obsolete data. It’s vital to set up log rotation and retention policies that balance your need for historical data with performance and storage considerations.
One common strategy is to implement a tiered approach. Recent logs, say from the past 30 days, are kept in fast-access storage. Older logs are archived in slower, but more cost-effective storage. This approach ensures that you have quick access to current logs while still retaining a comprehensive history for analysis.
At 1985, we follow strict retention policies. We use automated tools to rotate logs daily and archive them appropriately. This setup not only optimizes storage but also ensures that our engineers can access historical data when needed without sifting through terabytes of irrelevant information.
In our experience, the right balance is crucial. Too short a retention period, and you risk losing important historical data. Too long, and you may incur unnecessary costs and performance issues. Find a balance that fits your operational needs and adjust as your system grows.
Effective Monitoring Strategies
Logging is your record-keeper; monitoring is your watchful guardian. Both work hand in hand to keep your systems healthy. Let’s dive into some advanced strategies for effective monitoring.
Real-Time Metrics and Alerts
Monitoring isn’t just about looking at logs after the fact. It’s about real-time insights. Modern monitoring tools like Prometheus, Datadog, or New Relic provide dashboards and alerts that keep you informed about the state of your systems in real-time.
Metrics such as CPU usage, memory consumption, and network latency are critical. But at 1985, we’ve learned that it’s not just about the basic metrics. It’s about understanding the context. For example, a spike in CPU usage might be normal during a scheduled job, but abnormal during peak user hours.
The key is to set up alerts that are both sensitive and specific. Too many false positives, and you end up in alert fatigue. Too few, and you might miss a critical issue. A good monitoring system uses thresholds that are based on historical data and are tuned to your specific environment.

Real-time metrics empower your team to act before an issue escalates. When alerts are configured correctly, they become your first line of defense. A prompt alert can save you hours or even days of troubleshooting.
At 1985, we integrate monitoring alerts with our incident management system. This integration ensures that when an alert is triggered, the right team is notified immediately. Our incident response process is designed to be swift and effective, reducing downtime significantly.

Dashboard Design: Making Data Accessible
Dashboards are more than just graphs and numbers. They’re a narrative of your system’s health. A well-designed dashboard tells a story in a glance. It should highlight critical metrics and offer drill-down capabilities to investigate issues further.
In our daily operations at 1985, dashboards are a central piece of our monitoring strategy. They’re not just for the engineers on duty. They’re for every stakeholder—managers, developers, and even clients who want to see system performance. We strive to design dashboards that are intuitive, actionable, and aesthetically pleasing.
A good dashboard doesn’t overwhelm you with data. It prioritizes key metrics while offering the flexibility to dive deeper when needed. The balance between high-level overviews and detailed insights is crucial. When you design your dashboard, think of it as a conversation with your system. What does it need to tell you at a glance? And what details might you need to explore further?
At 1985, we iterate on our dashboard designs regularly. Feedback from the team is invaluable. We ask questions like: Are the alerts too frequent? Are the visualizations clear? What additional context might help during a crisis? This iterative process has resulted in dashboards that not only display data but actively contribute to our operational excellence.
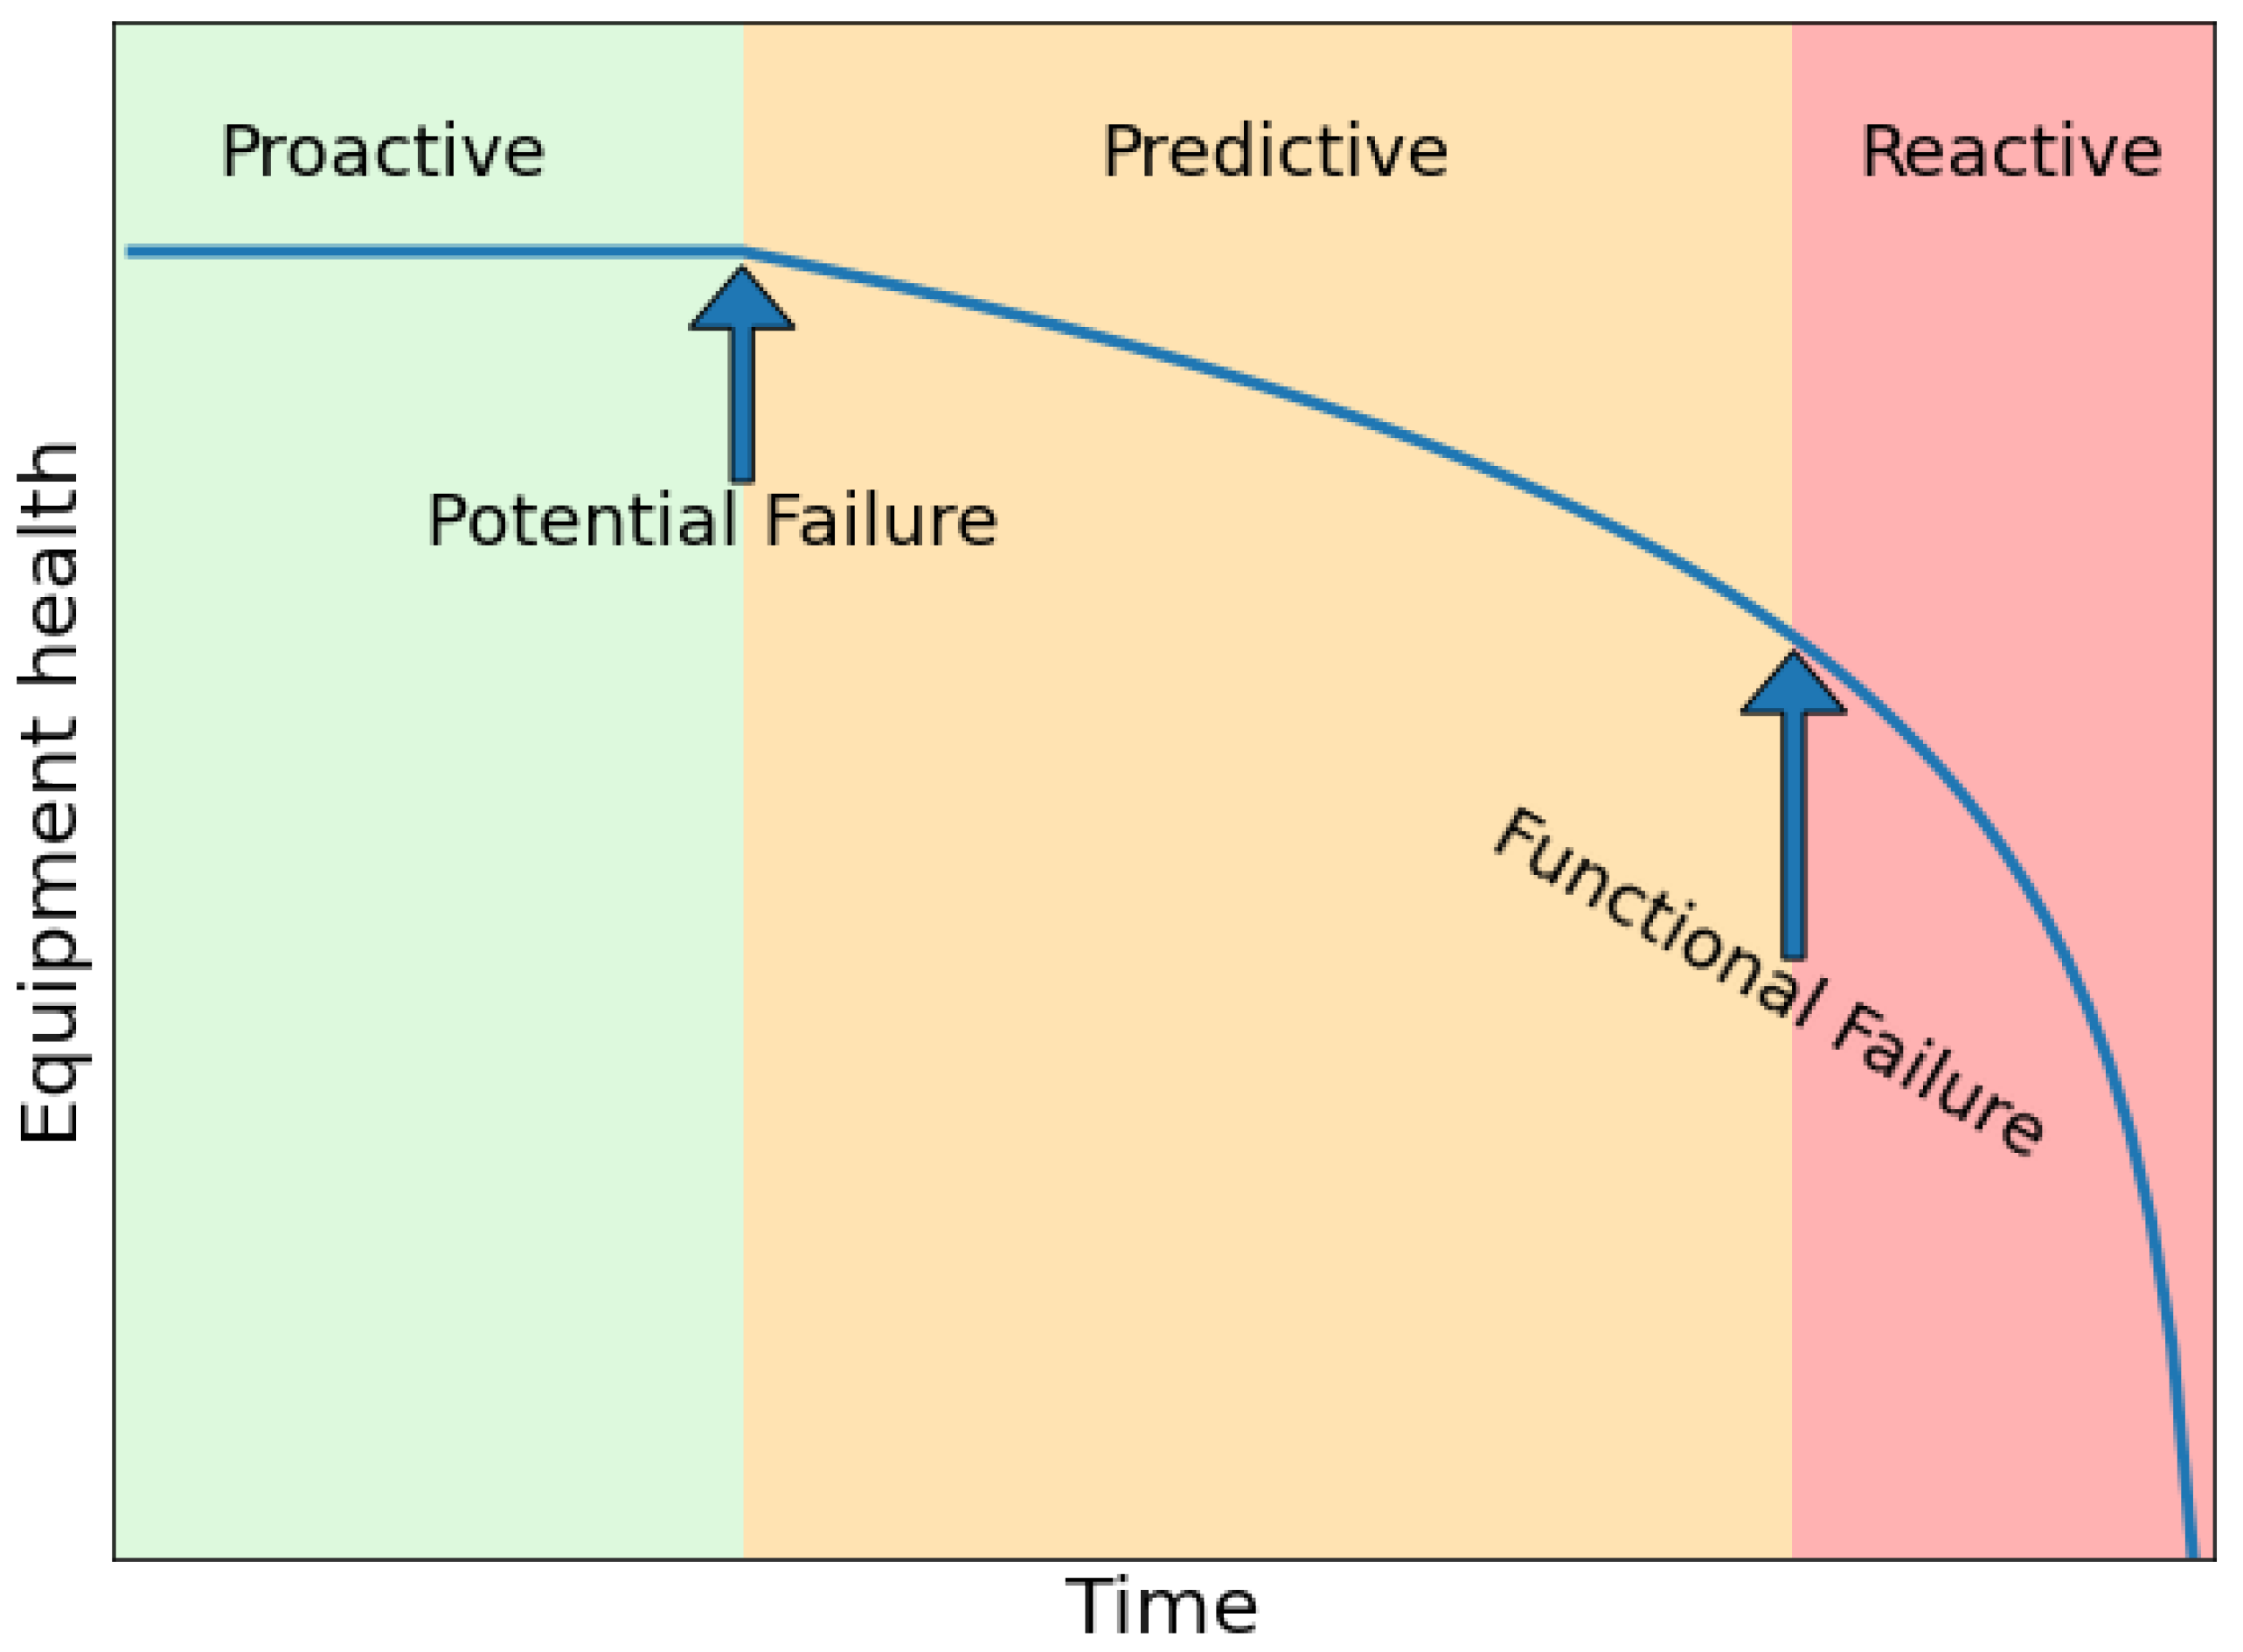
Proactive Monitoring and Anomaly Detection
One of the hallmarks of an effective monitoring system is its ability to detect anomalies proactively. Traditional monitoring systems are rule-based—they trigger alerts when predefined thresholds are crossed. However, modern systems are increasingly turning to machine learning and statistical methods to detect unusual patterns in data.
At 1985, we have experimented with anomaly detection tools that learn from historical data. These tools can detect subtle changes in behavior that might indicate an impending issue. For instance, a gradual increase in error rates might not trigger a threshold-based alert, but an anomaly detection system can spot the trend and alert you before a problem becomes critical.
This proactive approach is like having a sixth sense. It allows you to catch issues before they spiral out of control. In environments where system complexity is high, these proactive monitoring strategies are invaluable. They provide an additional layer of defense, ensuring that no matter how complex your system becomes, you’re always one step ahead.
There’s a balance to be struck, though. Machine learning models need time to learn and can sometimes generate false positives. It’s important to fine-tune these systems and combine them with traditional monitoring methods. The result is a robust, multi-layered approach to system health.

Integrating Logging with Monitoring
At first glance, logging and monitoring might seem like two separate concerns. In reality, they’re deeply intertwined. The best practices we follow at 1985 emphasize the integration of these two functions to provide a holistic view of system performance.
Correlating Logs with Metrics
When a system issue arises, logs and metrics tell different parts of the story. Metrics provide a high-level view of the system’s state, while logs offer the detailed narrative behind the numbers. Integrating these two sources of information allows for faster and more accurate troubleshooting.

Imagine you’re investigating a sudden spike in error rates. Your monitoring dashboard shows the spike, but it doesn’t tell you why it happened. By correlating that spike with detailed logs, you can quickly pinpoint the root cause. Perhaps a particular microservice started failing, or a database query went awry. This correlation is the key to rapid resolution.
At 1985, we use tools that automatically correlate logs with metrics. When an alert is triggered, the system pulls relevant logs and presents them alongside the corresponding metrics. This integrated view saves precious time during an incident, allowing our engineers to focus on solving the problem rather than searching for clues.
Here’s a simple workflow:
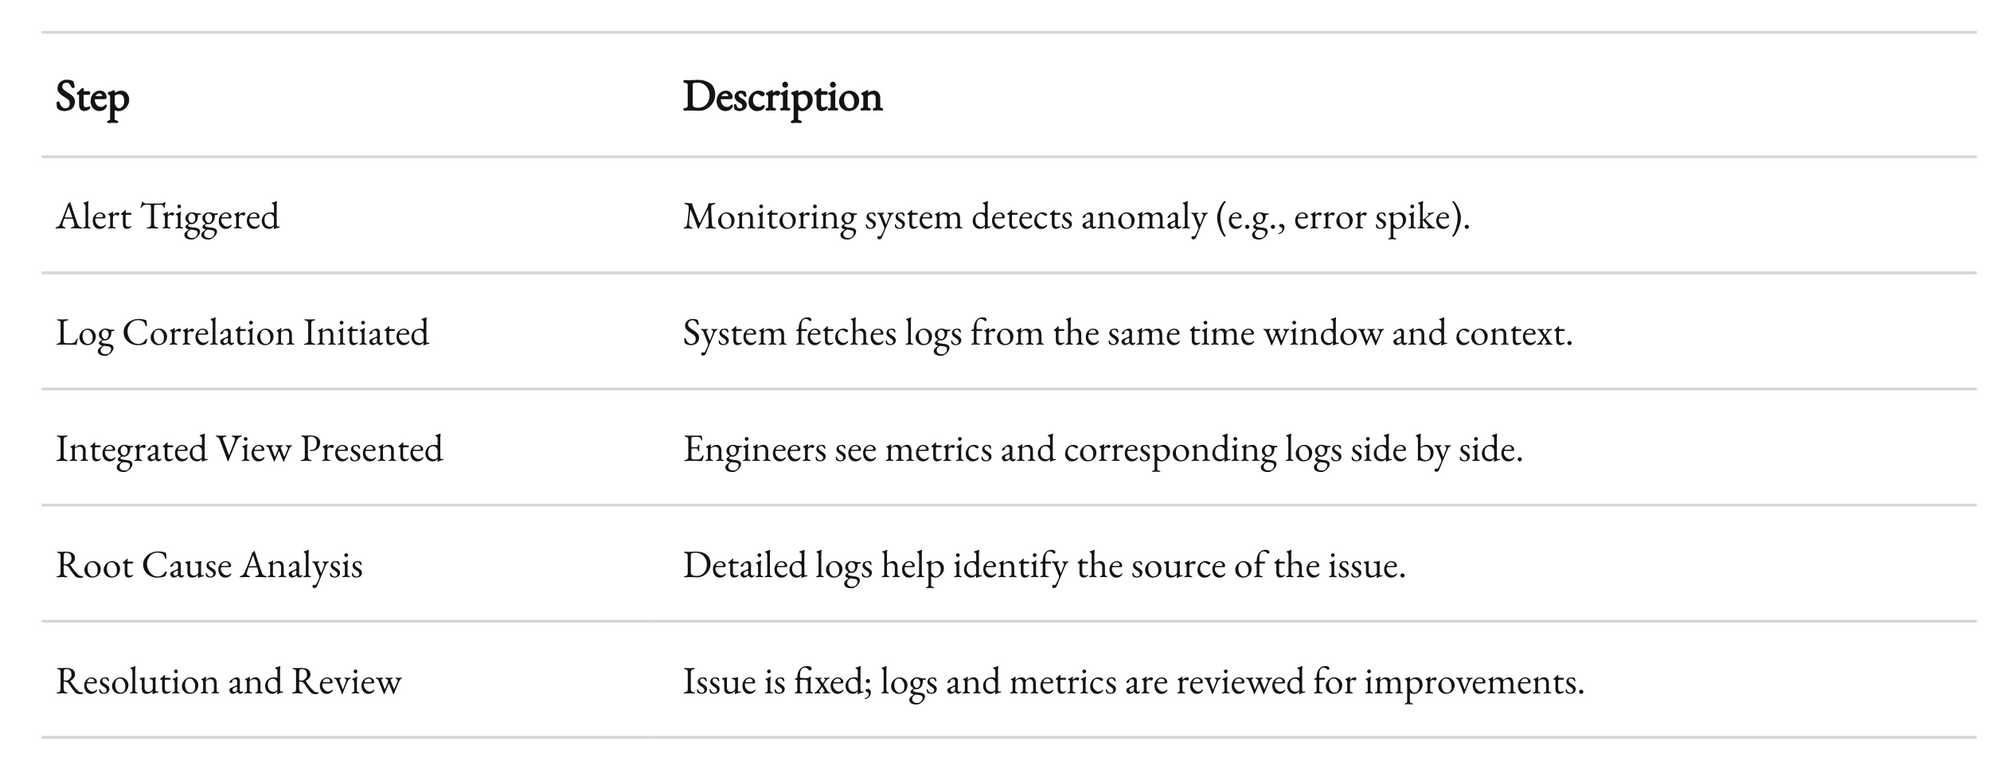
This workflow represents a streamlined process that minimizes downtime and maximizes efficiency. The synergy between logging and monitoring is not just an operational advantage—it’s a strategic necessity in today’s fast-moving tech environment.

Automated Incident Response
Another advanced practice is integrating logging and monitoring data with automated incident response systems. Automation can help filter noise, triage incidents, and even initiate predefined remediation steps. This means that when an issue is detected, your system can automatically apply a fix or at least mitigate the impact while the human experts take over.
At 1985, we have implemented several automated response mechanisms. For instance, if a service’s response time degrades beyond a certain threshold, our system might automatically scale up resources to handle the load. If a particular error rate spikes, an automated rollback might be triggered to restore service stability.
Automated incident response is not a silver bullet. It requires careful planning and thorough testing. But when done right, it can significantly reduce the impact of issues. It also frees up your team to focus on more complex problems rather than firefighting routine issues.
The key is to ensure that your automated systems are well-integrated with your logging and monitoring setup. This integration ensures that automation has the context it needs to make informed decisions. The result is a seamless, resilient system that minimizes downtime and maximizes reliability.
Advanced Techniques
In this section, we dive deeper into some of the more advanced and nuanced aspects of logging and monitoring. These techniques go beyond the basics and offer insights that are critical in today's complex, distributed environments.
Distributed Tracing
Distributed systems present a unique challenge. When your application is composed of multiple microservices, a single transaction can span several services and generate logs in multiple locations. This is where distributed tracing comes in. Distributed tracing allows you to follow a transaction from start to finish, regardless of how many services are involved.
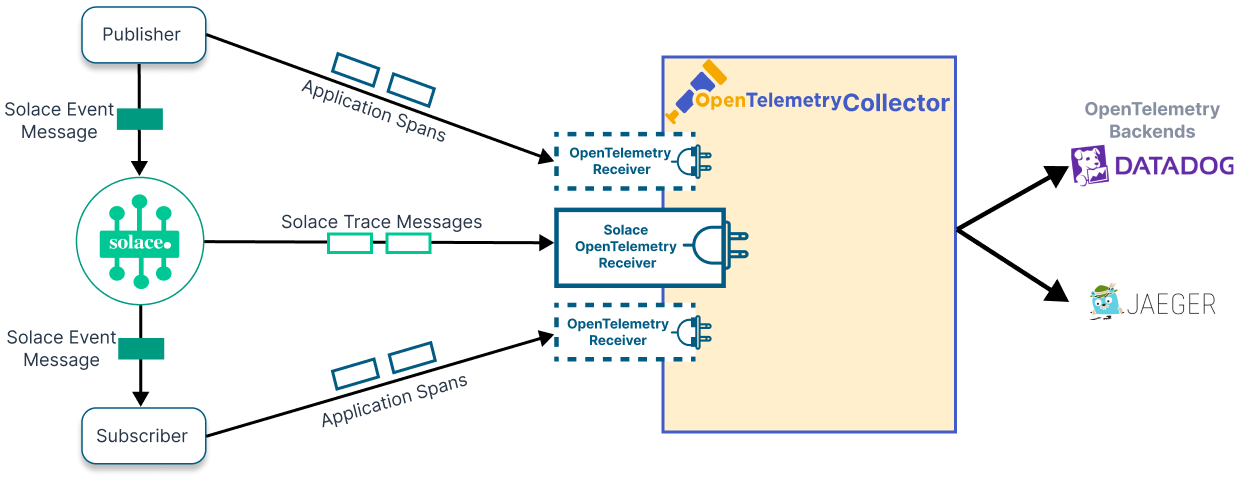
At 1985, we have integrated distributed tracing into our monitoring stack. Tools like Jaeger and Zipkin allow us to visualize the flow of requests through our system. This visualization is invaluable when trying to diagnose latency issues or pinpoint where errors are occurring in a chain of service calls.
The beauty of distributed tracing lies in its ability to provide a clear picture of system performance. It’s not enough to know that an error occurred; you need to know where, when, and why. With distributed tracing, you can see the entire journey of a request. This granular level of detail is indispensable for troubleshooting in a microservices architecture.
Consider this flow chart that outlines the journey of a request:
flowchart TD
    A[Client Request] --> B[API Gateway]
    B --> C[Authentication Service]
    C --> D[Business Logic Service]
    D --> E[Database Service]
    E --> F[Response Assembler]
    F --> G[Client Response]
Each node in this flow represents a potential point of failure. Distributed tracing connects the dots, allowing you to see the complete picture and act swiftly.
Contextual Logging for Security and Compliance
Security is not an afterthought. It’s baked into every line of code and every log entry. When it comes to logging, contextual data is crucial for both security and compliance. Logs should not only capture what happened but also why it happened.
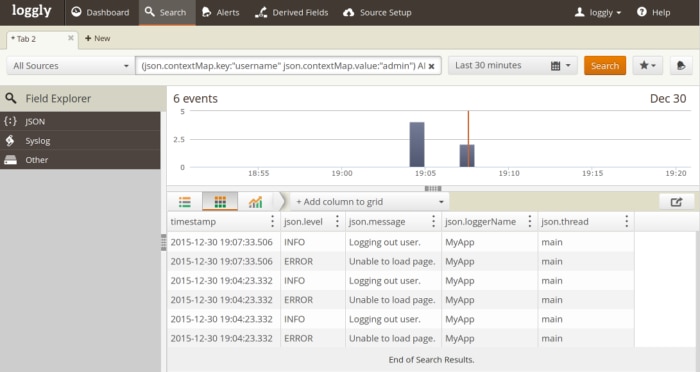
For example, including user IDs, session tokens, and even geographic data in your logs can be invaluable when investigating security incidents. However, this must be done in a way that respects user privacy and complies with regulations such as GDPR or HIPAA. At 1985, we’ve developed a practice of contextual logging that balances the need for detailed security information with the imperative to protect sensitive data.
Contextual logging also plays a critical role in auditing. When a security breach occurs, having logs that provide detailed context can make the difference between a prolonged investigation and a swift resolution. Auditors look for logs that tell a coherent story of events, and well-contextualized logs provide that narrative.
Here’s a simplified example of a contextual log entry for a security event:
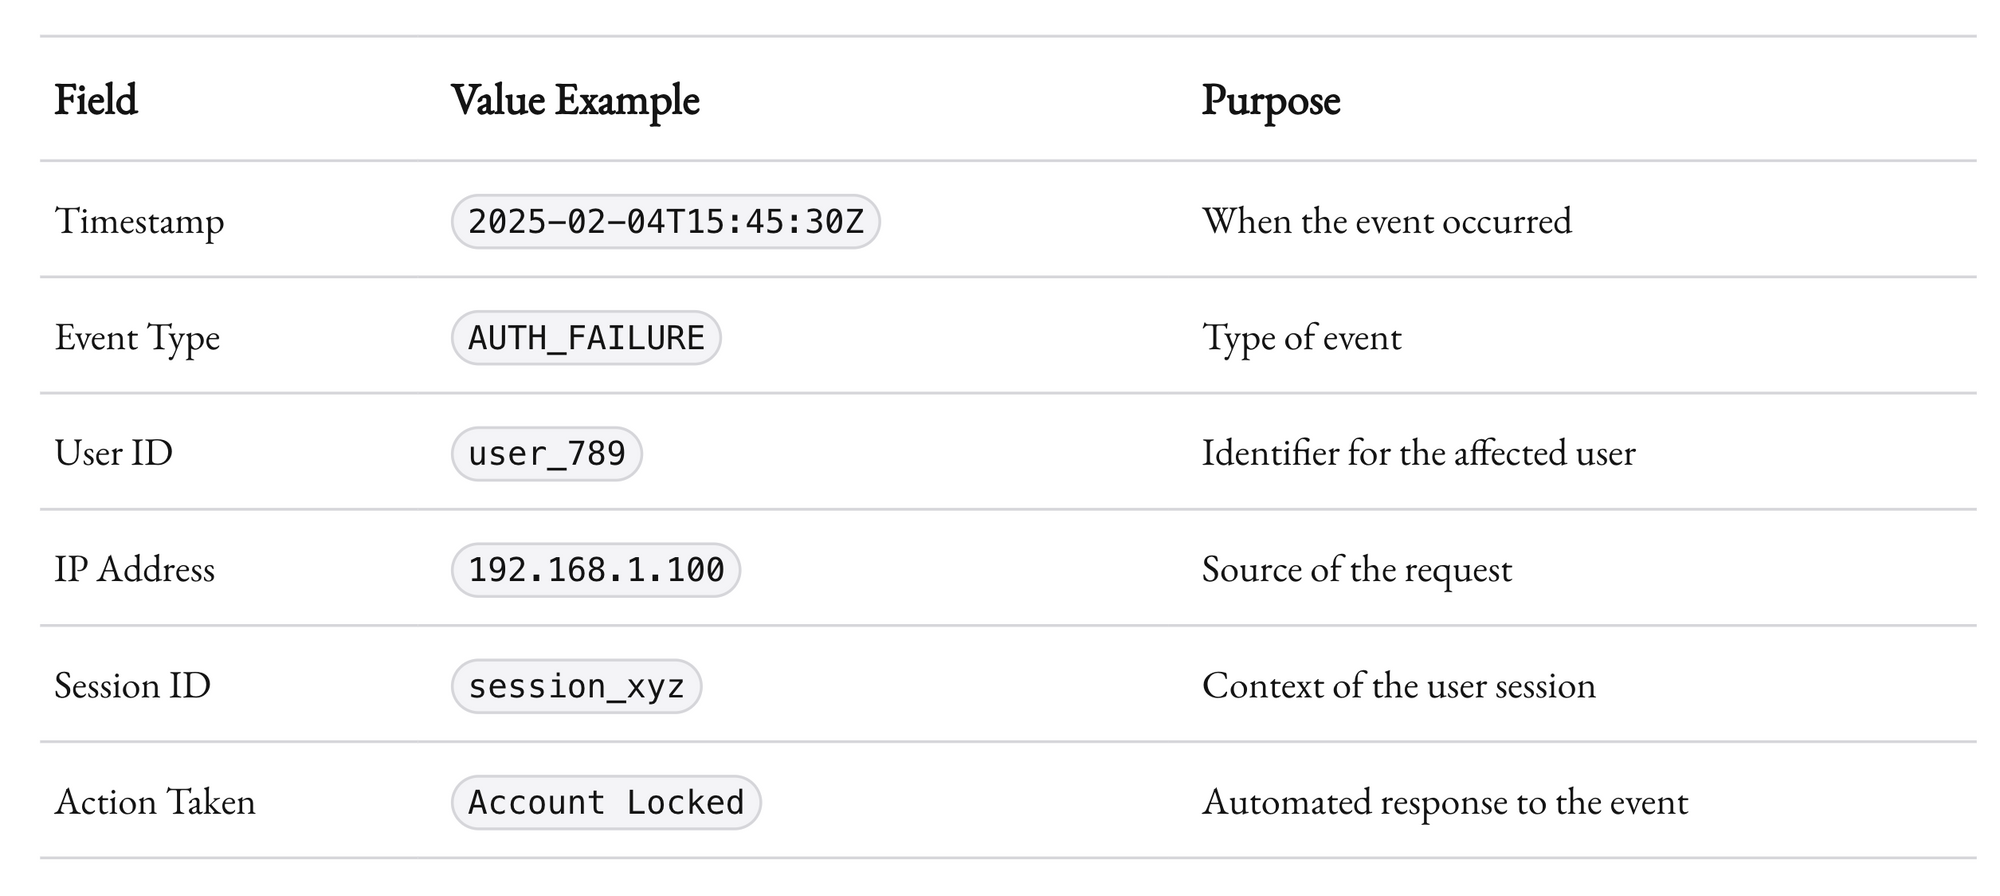
This level of detail is not merely for show. It provides a robust framework for both immediate response and long-term analysis. By embedding context into each log entry, you create a valuable historical record that can guide future security policies and compliance efforts.
Handling High-Volume Data
Modern applications generate logs at an unprecedented scale. Handling this volume efficiently is a challenge that many organizations face. At 1985, we’ve learned that scalability is key. The tools and practices you adopt must be capable of handling high-volume, high-velocity data without compromising on performance or accuracy.
A few techniques help manage high-volume logging:
- Sampling: Not every single log entry needs to be stored forever. Sampling can reduce volume while still providing representative insights.
- Indexing: Efficient indexing of logs ensures that even as volume grows, search and retrieval remain fast.
- Partitioning: Dividing logs into logical segments (e.g., by time, service, or environment) helps manage data better and speeds up queries.
We regularly benchmark our logging systems to ensure they perform well under peak loads. The goal is to maintain performance without sacrificing the granularity or integrity of the data. This balance is critical when dealing with distributed systems where log volume can vary dramatically.

These strategies have helped us maintain a scalable logging infrastructure that can adapt as our clients’ needs evolve. The key is to plan for growth and remain flexible in your approach.
Integrating Third-Party Tools and APIs
No logging or monitoring system exists in a vacuum. Modern systems often rely on third-party tools and APIs to enhance functionality. From cloud-based log storage to AI-driven analytics, integrating the right external tools can provide significant advantages.
At 1985, we evaluate third-party tools rigorously. We consider factors such as ease of integration, scalability, security, and cost. Tools like Datadog, Splunk, and Elastic Stack have become mainstays in our toolkit. They offer robust APIs that allow us to tailor solutions to our specific needs.
A key consideration is ensuring that your integrations do not become a single point of failure. Redundancy and failover strategies must be in place. For example, if your primary monitoring API goes down, your system should have a backup to maintain visibility.
Integrating third-party tools often means dealing with multiple data formats and protocols. Building a middleware layer that standardizes data across various sources can simplify this process. This layer becomes the backbone of your monitoring ecosystem, ensuring that all data is consistent and actionable.
Learning from Experience
Theory is essential, but nothing beats real-world experience. At 1985, we’ve encountered our share of challenges and triumphs when it comes to logging and monitoring. Here are a few case studies that illustrate the impact of these practices.
Case Study 1: Preventing a Major Outage
A few years ago, one of our clients experienced intermittent performance issues during peak hours. At first, the problem was elusive. Our standard metrics didn’t flag any obvious anomalies. However, by integrating advanced log correlation and distributed tracing, we discovered that a small but critical microservice was periodically failing to communicate with its database.
We set up targeted alerts and reconfigured the service to handle timeouts more gracefully. Within weeks, the error rate dropped significantly, and the client’s system stability improved. This incident underscored the value of a proactive, integrated logging and monitoring system. The client later reported that these improvements saved them an estimated 10–15% in potential lost revenue during peak periods.
This case study taught us that even minor issues, if left unchecked, can escalate into major problems. By investing in robust monitoring and logging systems, you can detect and address issues before they impact your bottom line.
Case Study 2: Enhancing Security Through Contextual Logging
Another project involved a financial services company with strict compliance requirements. They needed a logging system that could not only track performance but also capture detailed security-related context for every transaction. We implemented contextual logging that included user IDs, transaction details, and precise timestamps. When a security breach was suspected, the rich context allowed their security team to quickly pinpoint the source of the issue and take corrective action.
The detailed logs also helped during a regulatory audit. The auditors were impressed by the level of detail and the ability to trace each step of a transaction. The company not only passed the audit with flying colors but also gained increased confidence in their security posture. This experience highlighted the dual benefits of detailed logging: operational troubleshooting and regulatory compliance.
Case Study 3: Scaling for Growth
A tech startup we worked with was experiencing explosive growth. Their logging system, designed for a smaller operation, began to buckle under the increased volume. We re-engineered their logging pipeline to incorporate efficient sampling, advanced indexing, and real-time processing. By partitioning logs based on service and time, we were able to handle the increased volume without sacrificing performance.
This upgrade not only improved system performance but also provided deeper insights into usage patterns and performance bottlenecks. The startup used these insights to optimize their services and improve the overall user experience. It was a clear reminder that as your business grows, so must your logging and monitoring systems.
The Human Element in Logging and Monitoring
Technology is only as good as the people who manage it. While tools and automation play a huge role in logging and monitoring, human oversight remains irreplaceable. At 1985, we emphasize a culture of proactive monitoring and continuous improvement.
Training and Onboarding
It’s not enough to have state-of-the-art tools if your team doesn’t know how to use them effectively. Continuous training and thorough onboarding are critical. Every engineer must understand not just how to interpret logs and metrics, but also how to respond to alerts in a structured manner.
We invest heavily in regular training sessions, workshops, and simulation drills. These exercises ensure that our teams are ready to handle real incidents with confidence. The goal is to make the process as intuitive as possible so that, when something goes wrong, every team member knows their role and can act decisively.
Fostering a Culture of Accountability
Effective logging and monitoring require a cultural shift. It’s about accountability and continuous learning. Every incident is an opportunity to refine processes and prevent future issues. At 1985, we conduct thorough post-incident reviews to identify what worked, what didn’t, and how we can improve.
These reviews are candid and constructive. We focus on learning rather than blaming. The insights gained from these sessions often lead to updates in our logging practices, alert thresholds, and even our codebase. The idea is to create an environment where every team member feels responsible for the health of the system.
Collaboration Across Teams
No one person can monitor every aspect of a complex system. Collaboration between development, operations, and security teams is essential. Regular cross-team meetings ensure that insights from logging and monitoring are shared, and that everyone is aligned on the system’s health and performance.
At 1985, our cross-functional teams meet weekly to review performance metrics, discuss recent incidents, and plan improvements. This collaborative approach ensures that our logging and monitoring strategies evolve continuously, driven by insights from all corners of the organization.
A Journey, Not a Destination
Implementing effective logging and monitoring is a journey. There is no one-size-fits-all solution. It’s a process of continuous refinement, learning, and adaptation. As technology evolves, so do the challenges and opportunities in logging and monitoring.
At 1985, we believe that the key to success lies in the details. It’s in the structured log entries, the finely tuned alerts, the well-designed dashboards, and the deep collaboration among teams. It’s about building an ecosystem that not only detects problems but also provides the context needed to solve them swiftly.
Effective logging and monitoring transform how you manage your systems. They turn data into insights, insights into action, and action into success. They are the backbone of a resilient, high-performing operation. As you refine your practices, remember that every log entry and every metric is a piece of the puzzle. Together, they form a comprehensive picture of your system’s health.
The journey isn’t easy. There are trade-offs between performance and granularity, between automation and human oversight. There are moments when the data seems overwhelming and the alerts incessant. But in those moments lies the opportunity to innovate, to streamline, and to excel. Every incident handled and every insight gained is a step forward on that journey.
Remember, the goal is not perfection. It’s progress. It’s about creating a system that can adapt, respond, and evolve as your business grows. And when you invest in robust logging and monitoring practices, you invest in the very future of your operations.
Key Takeaways
Let’s summarize the best practices we’ve discussed:
- Structured Logging: Ensure consistency in your logs by using structured formats and including essential fields such as timestamp, log level, service name, and contextual tags.
- Centralized Logging: Use tools like the ELK stack or Splunk to centralize your logs for unified search and analysis.
- Retention and Rotation Policies: Implement strategies to manage log data efficiently, balancing historical value with system performance.
- Real-Time Monitoring: Leverage modern tools for real-time metrics and alerts. Set thresholds that are informed by historical data.
- Dashboard Design: Create intuitive dashboards that provide both high-level overviews and detailed insights.
- Proactive Anomaly Detection: Use machine learning and statistical methods to identify issues before they become critical.
- Integration of Logs and Metrics: Correlate logs with metrics to quickly diagnose and resolve incidents.
- Automated Incident Response: Use automation to handle routine issues, freeing up your team for more complex challenges.
- Advanced Techniques: Incorporate distributed tracing, contextual logging, and scalable data management strategies.
- Human-Centric Approach: Invest in training, foster a culture of accountability, and promote cross-team collaboration.


