How Effective Analytics Can Power Your Scaling Decisions
Discover how effective analytics can guide your scaling strategy and boost your business growth.


I feel like I’ve seen it all. In the world of outsourced software development at 1985, scaling isn’t just about hiring more developers or winning bigger projects. It’s about understanding every facet of your business and using that insight to make informed decisions. In our fast-paced industry, decisions made in a vacuum lead to costly mistakes. Analytics gives us the data to decide wisely. It shows us what works, what doesn’t, and where the hidden opportunities lie.
Today, I want to dive deep into how you can implement effective analytics to inform your scaling decisions. This isn’t a one-size-fits-all playbook. It’s a blend of hands-on experience, industry-specific insights, and a few hard-learned lessons from my own journey at 1985. Grab a cup of coffee, sit back, and let’s talk about building a growth machine fueled by data.
Role of Analytics in Scaling
Analytics is the heartbeat of any business scaling strategy. It’s the process of turning raw data into meaningful insights that drive action. But let’s break that down further.
In my experience, scaling without proper analytics is like navigating a storm without a compass. Data tells you where you’re headed. It reveals the intricacies of your operations, from project timelines and developer productivity to client satisfaction and financial performance. Without these insights, you risk investing in the wrong areas, overestimating capacity, or missing critical warning signs.
Effective analytics is not about drowning in spreadsheets or chasing every single metric. It’s about identifying the key performance indicators (KPIs) that truly matter to your business. These KPIs provide a clear picture of your current performance and signal areas for improvement. For instance, a well-defined KPI in our industry might be the “project turnaround time” or “client retention rate” rather than just raw revenue numbers.
At 1985, our scaling strategy is driven by data that pinpoints our strengths and highlights our vulnerabilities. We break down each project into quantifiable metrics. We track developer performance, bug rates, time-to-resolution, and client feedback. This level of granularity ensures that when we scale, we’re doing so on a foundation of solid performance metrics.
When we talk about scaling, we mean scaling both operations and value. Analytics gives you the vision to invest in the right technology, hire the right talent, and sometimes, even pivot your business model. I’ve learned that making decisions based on gut feeling can only take you so far. The companies that thrive are the ones that listen to their data.
Why Traditional Metrics Fall Short
The software development industry is evolving rapidly. Traditional metrics like lines of code written, hours billed, or even client acquisition numbers simply don’t capture the complexities of our work. In the modern environment, these metrics can be misleading. They might paint a rosy picture of activity but fail to reflect true productivity or client satisfaction.
For example, counting lines of code is an antiquated metric. More code does not necessarily mean better code. What matters more is the quality of that code and the functionality it delivers. Instead of measuring the sheer volume, we focus on code efficiency, maintainability, and the rate of defect resolution. In our scaling discussions, a metric such as “defect density” or “mean time to recovery (MTTR)” provides a clearer picture of how robust our systems are.
Similarly, billing hours doesn’t capture innovation or the strategic value delivered to clients. Instead, metrics such as “value delivered per project” or “client ROI” are far more indicative of success. At 1985, we’ve transitioned from the mindset of “more is better” to one of “quality over quantity.” The data we collect reflects not just the work done, but the impact it creates.

Here’s a simple comparison to illustrate how traditional metrics compare to modern, data-driven metrics:
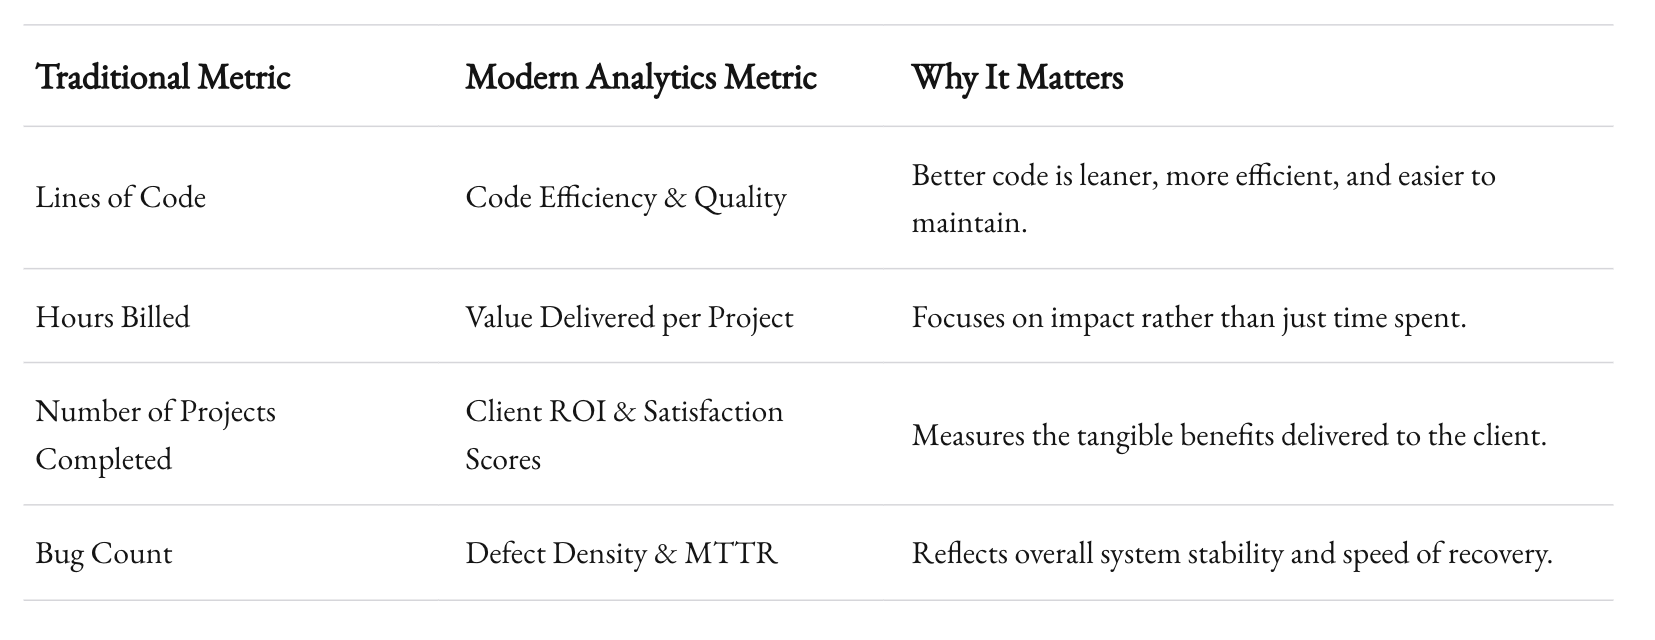
The evolution from traditional to modern metrics is not just a change in numbers. It’s a paradigm shift in how we view success and growth. Effective analytics empowers us to ask the right questions and get answers that truly reflect our operational health.
Building a Robust Analytics Framework
Step 1: Define Clear Objectives
Before diving into the sea of data, you need to have clear objectives. What exactly are you trying to achieve with your analytics? Are you looking to optimize internal processes? Improve client satisfaction? Increase revenue margins? Defining these objectives ensures that you’re not collecting data for the sake of data.
At 1985, our objectives are tailored to our unique business model. We are laser-focused on two main areas: operational efficiency and client value creation. Operational efficiency means tracking and improving the performance of our development teams. Client value creation, on the other hand, involves ensuring that every project delivers measurable benefits to our clients.
Defining these objectives will guide your data collection strategy. You might decide to focus on metrics like project delivery times, defect resolution rates, or customer satisfaction scores. It’s essential to choose metrics that align with your business’s strategic goals. If your objective is to improve quality, focus on metrics that capture error rates, code review scores, or post-deployment performance.
Once your objectives are set, you can map them to specific KPIs. These KPIs become the cornerstone of your analytics strategy, ensuring that every decision is grounded in data that matters.

Step 2: Invest in the Right Tools
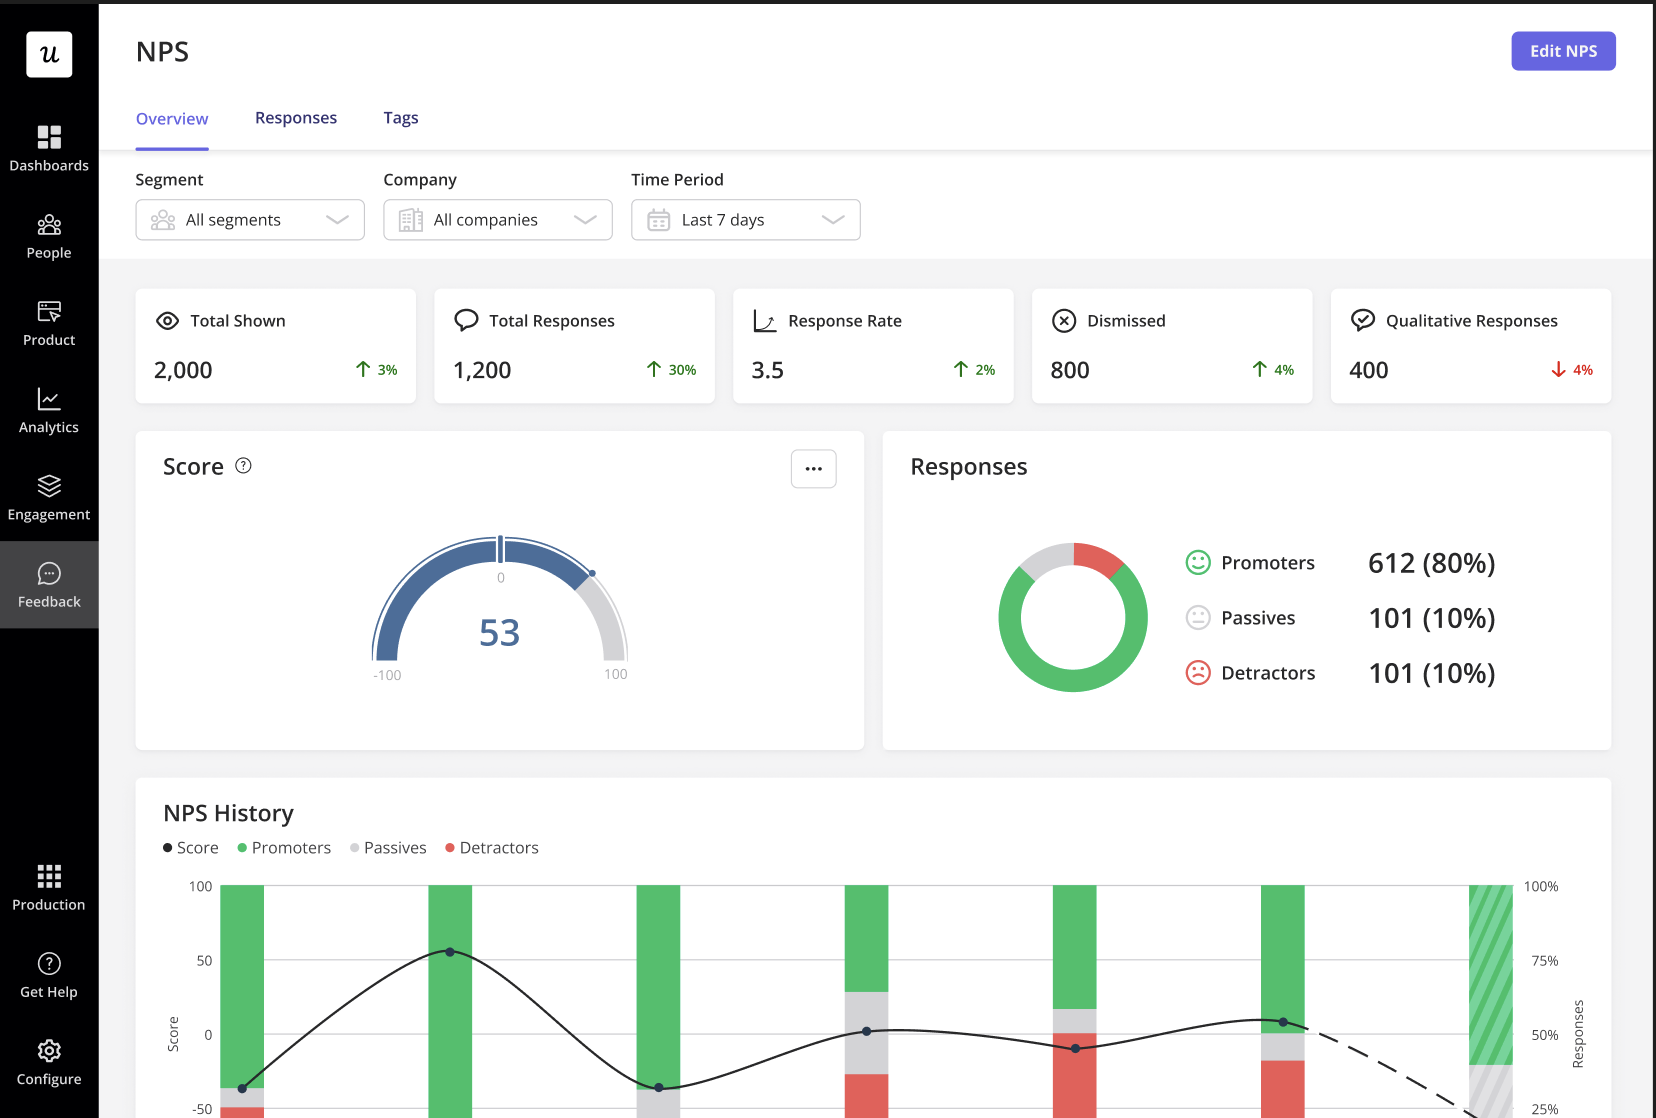
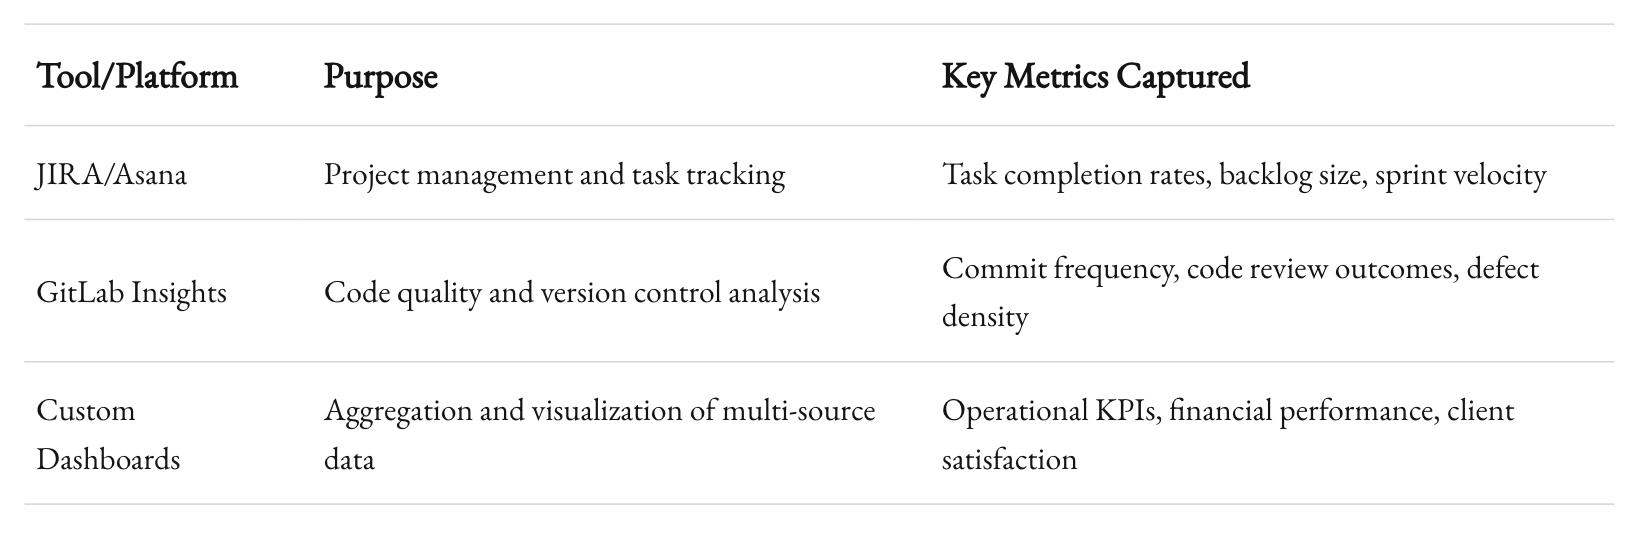
The market is flooded with analytics tools, each promising to unlock insights hidden within your data. However, not all tools are created equal. You need tools that are tailored to your industry’s needs. For outsourced software development, tools like JIRA for project tracking, Git analytics platforms for code quality, and customer feedback platforms like NPS (Net Promoter Score) tools are essential.
At 1985, we’ve integrated a suite of tools that collectively provide a 360-degree view of our operations. For instance, we use a combination of:
- JIRA and Asana for project management.
- GitLab Insights to analyze code contributions and detect bottlenecks.
- Custom dashboards that bring together data from various sources into a single, actionable interface.
Each tool has its strengths. The key is to ensure they communicate well with each other. Data silos are the enemy of effective analytics. Integration platforms like Zapier or custom-built APIs can help create a seamless flow of information. This interconnected ecosystem allows you to drill down into every aspect of your operations—from individual task performance to overarching project timelines.
By investing in the right tools, you ensure that your data is not just collected—it’s actionable. The integration of these systems provides the clarity needed to make scaling decisions that are both informed and strategic.
Step 3: Ensure Data Integrity
No analytics strategy is effective without high-quality data. Data integrity is paramount. This means ensuring your data is accurate, consistent, and up-to-date. In the rush of scaling, it’s tempting to prioritize speed over quality. But mistakes in your data can lead to misinformed decisions that have costly repercussions.
At 1985, we’ve established strict protocols for data collection and validation. Automated checks and balances, periodic audits, and a dedicated team to monitor data quality are part of our routine. We also employ anomaly detection algorithms to flag outlier data points that may indicate errors in the system.
Implementing data integrity protocols involves:
- Data Validation: Verifying the accuracy of data at the point of entry.
- Regular Audits: Conducting periodic reviews to ensure data consistency across platforms.
- Anomaly Detection: Using statistical models to identify and correct discrepancies.
These steps might seem laborious, but the payoff is immense. Reliable data builds confidence in your scaling decisions. It ensures that when you see a trend or anomaly, you can trust that it reflects the true state of your operations.
Choosing the Right Metrics
Beyond Vanity Metrics
It’s easy to get caught up in vanity metrics. Metrics that look good on paper but don’t drive meaningful change are seductive. For example, website hits or social media followers might boost your ego, but they don’t tell you much about the health of your outsourced software development projects.
For us at 1985, the focus is on metrics that align directly with operational success and client value. Let’s consider a few key metrics:
- Code Quality Metrics:
Instead of counting lines of code, we measure code complexity, code churn, and defect density. This provides insight into the maintainability of our codebase and helps forecast future technical debt.
Stat Spotlight: Studies have shown that projects with high code churn are 30% more likely to encounter critical bugs in production. This is why we focus on stability rather than sheer volume. - Operational Efficiency:
Metrics like sprint velocity, cycle time, and bug resolution time are crucial. They help us understand how quickly we can deliver value to our clients and identify process bottlenecks.
Quote to Consider: “Speed is useful only if you’re going in the right direction.” – Anonymous developer, echoed by industry leaders. - Client Success Metrics:
Beyond just revenue, client success metrics such as Net Promoter Score (NPS) and customer lifetime value (CLV) reveal how satisfied clients are with our services. They are strong predictors of long-term relationships and recurring business.
Data Point: According to a recent survey, companies with high NPS scores are 2.5 times more likely to scale successfully, reflecting the direct correlation between client satisfaction and sustainable growth.
By carefully selecting metrics that matter, you’re not just accumulating data—you’re building a roadmap for scaling success. These metrics act as early warning systems. They tell you when to invest more resources, when to tighten processes, and when to pivot strategies.
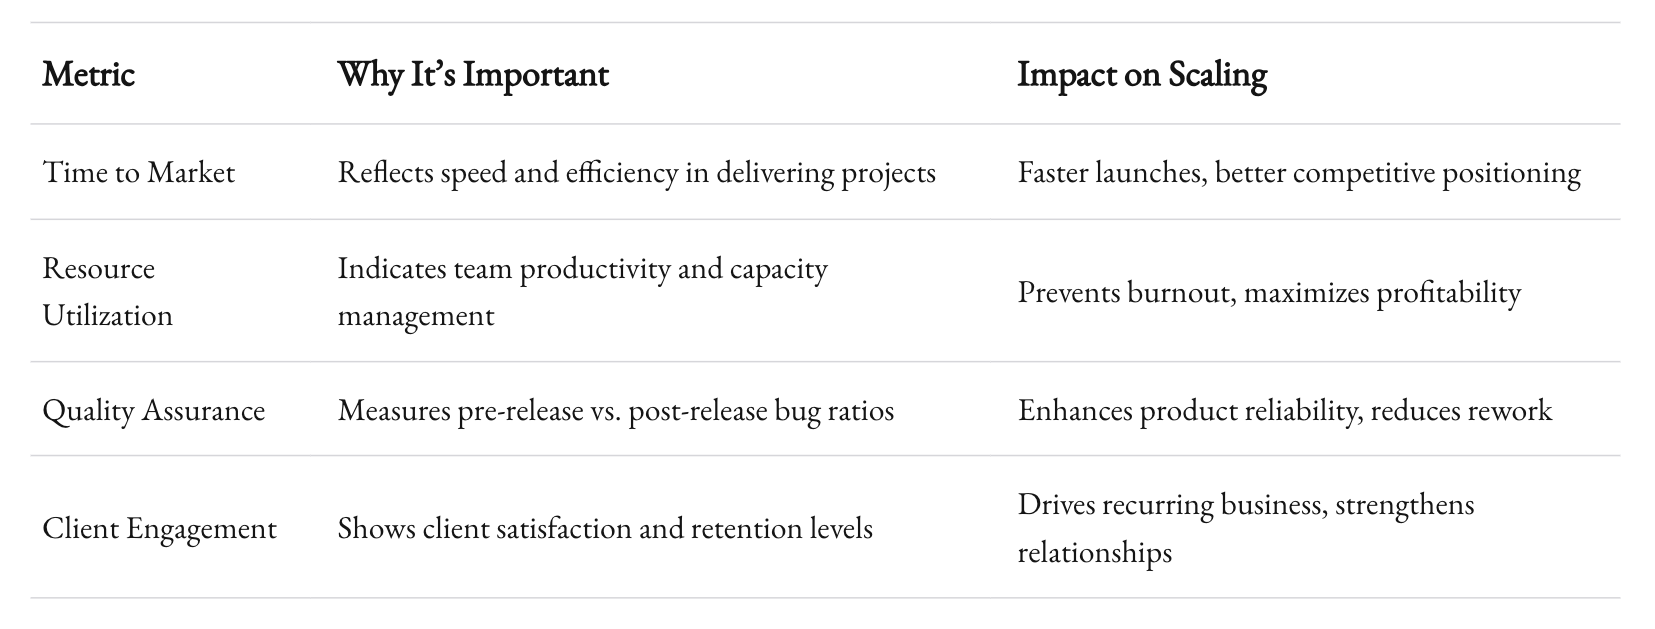
Metrics That Matter in Outsourced Software Development
Let’s drill down into some niche metrics that are particularly relevant to outsourced software development:
- Time to Market:
How long does it take from ideation to deployment? In our business, faster time-to-market can be a competitive advantage. Detailed tracking helps refine processes and eliminate delays. - Resource Utilization:
Are our teams being utilized effectively? Analyzing billable versus non-billable hours, overtime trends, and workload distribution ensures that we maintain optimal productivity without burnout. - Quality Assurance Metrics:
This includes the ratio of bugs found in pre-release versus post-release environments. Early detection rates can save significant costs and preserve client trust. - Client Engagement:
Frequency of client interactions, feedback loop responsiveness, and the resolution time for client queries provide deep insights into customer satisfaction. This metric helps shape client support strategies and predict future revenue streams.
Data-Driven Decision-Making in Practice
Case Study: Scaling with Precision
Let me share a case from 1985. We were at a crossroads, ready to scale up our operations, but unsure where to invest our resources for maximum impact. We had data coming in from multiple channels—project management software, code repositories, client feedback tools—and it was overwhelming. The turning point came when we decided to integrate this data into a unified dashboard.
The dashboard gave us a bird’s-eye view of our operations. We could see that our sprint velocity was high, but our defect density was creeping up. The insight was clear: our teams were moving fast, but the quality of output was slipping. We dug deeper and discovered that the rush to deliver was leading to corner-cutting in quality assurance. Armed with this data, we made a strategic decision. We invested in additional QA resources and implemented stricter code review protocols. The result? A measurable improvement in code quality and a reduction in post-release bugs by 25% within six months.
This isn’t an isolated case. Data-driven decision making allowed us to fine-tune every aspect of our operations. When you see trends early, you can pivot before small issues become systemic problems. The key is to be proactive. Analytics isn’t just about reacting to what’s happening—it’s about forecasting future challenges and opportunities.
Creating a Culture of Data-Driven Insights
Implementing analytics isn’t just about tools and metrics; it’s about cultivating a mindset. At 1985, we have worked hard to build a culture where data drives our every decision. Here’s how we achieved it:
- Transparency:
We share our dashboards and key metrics with every team member. Everyone from developers to project managers knows where we stand and where we need to improve. This transparency fosters accountability and collaboration. - Continuous Learning:
Analytics is an ongoing process. We hold regular review meetings where we analyze performance data, discuss challenges, and brainstorm improvements. This isn’t a quarterly exercise—it’s part of our daily operations. - Empowerment:
When team members see the impact of their work through data, it boosts morale and ownership. It’s not just management making decisions based on numbers; everyone contributes insights. Empowered teams are more agile and responsive. - Feedback Loops:
We continuously solicit feedback from our clients and integrate that data into our processes. This creates a virtuous cycle where every improvement is validated by real-world performance.
Building a culture of data-driven decision making has been transformative. It takes time and commitment, but the payoff is immense. You create an environment where decisions are objective, transparent, and directly tied to your business’s success.
Tools and Technologies: A Closer Look
The Analytics Ecosystem
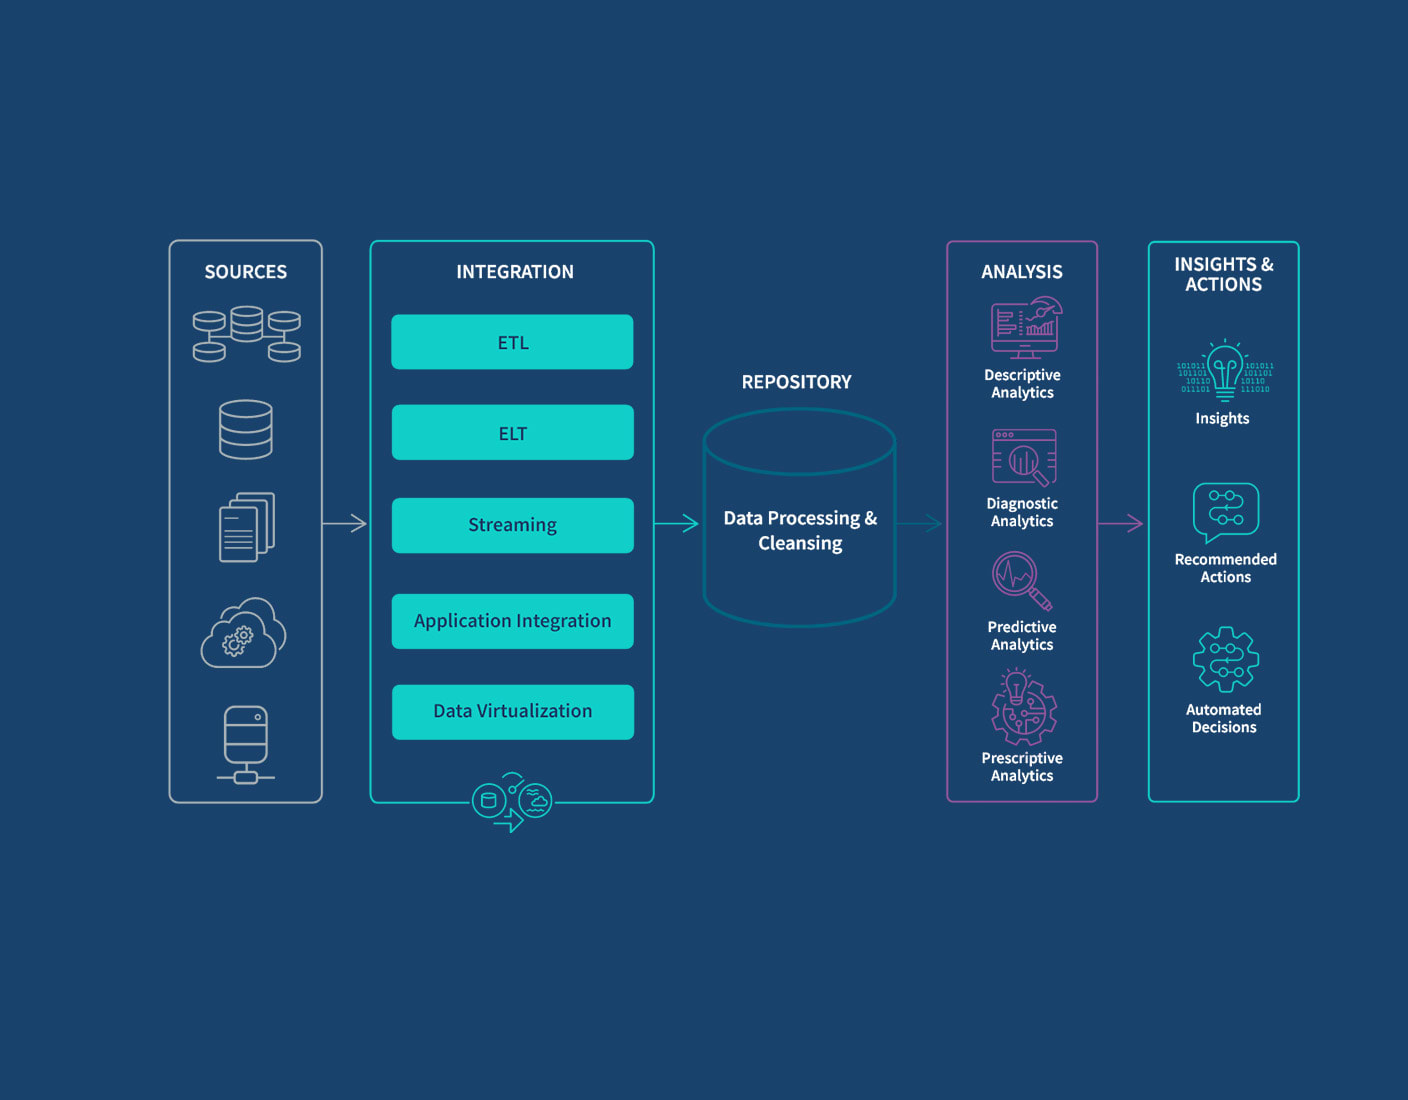
In today’s digital age, the tools you choose can make or break your analytics strategy. Let’s dive into the core components of an analytics ecosystem for an outsourced software development firm like 1985.
1. Data Collection and Integration Tools
Data is scattered across various systems: project management tools, code repositories, customer feedback platforms, and even financial systems. The first step is to integrate these disparate data sources into a single repository. Tools like Segment or Fivetran help in aggregating data from multiple platforms.
Why it matters:
A centralized data repository means that you’re not working in silos. When your data is integrated, it becomes easier to identify patterns and correlations. For instance, linking client feedback with code quality data might reveal that certain projects require more rigorous testing protocols.

2. Data Visualization Platforms
Once you have the data, you need to visualize it. Platforms like Tableau, Power BI, or even custom-built dashboards allow you to create intuitive visualizations. These visualizations help you grasp complex data sets at a glance. At 1985, we often rely on real-time dashboards that track key metrics like project velocity, resource utilization, and client satisfaction.
Why it matters:
Visual dashboards transform numbers into narratives. They tell a story of where your business is excelling and where it’s lagging. With a well-designed dashboard, even the most intricate data becomes accessible and actionable.
3. Predictive Analytics and Machine Learning
Beyond descriptive analytics, predictive analytics is crucial. Tools such as TensorFlow, Azure Machine Learning, or Scikit-learn allow you to forecast trends and potential issues before they manifest. For example, using historical data to predict project delays or forecast resource needs can be a game changer.
Why it matters:
Predictive analytics shifts your focus from reactive to proactive. Instead of fixing problems after they occur, you anticipate them and adjust accordingly. This is essential in an industry where timelines and quality are non-negotiable.
4. Collaboration and Communication Tools
Analytics is only as good as the actions it drives. Tools like Slack, Microsoft Teams, and integrated project management software facilitate communication. They ensure that insights are shared quickly and that every team member is aligned on the necessary actions.
Why it matters:
Effective communication turns data insights into operational changes. When teams are connected, decisions based on analytics are implemented faster and more efficiently.
A summary of the analytics ecosystem:
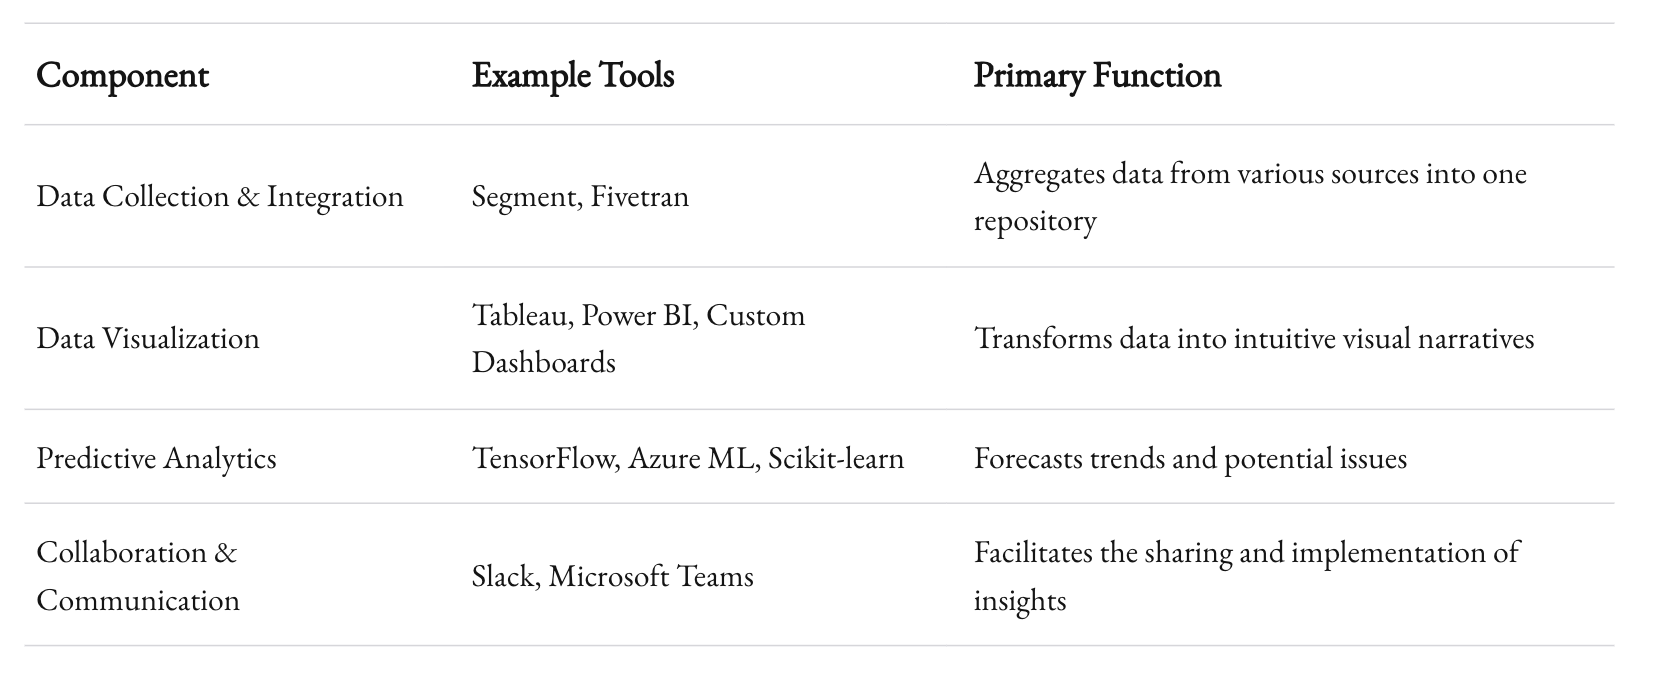
Integrating these tools creates a powerful ecosystem that informs every scaling decision. It transforms raw data into actionable insights, guiding your business to operate at peak efficiency.

Addressing Challenges and Common Pitfalls
Data Overload
In our industry, the sheer volume of data can be overwhelming. It’s easy to fall into the trap of analyzing too much information and losing focus on what truly matters. Data overload leads to decision paralysis, where you’re buried under the weight of too many metrics.
How to combat this:
- Prioritize KPIs: Focus on the metrics that directly impact your strategic goals.
- Set Clear Objectives: Establish what success looks like for your business and align your analytics around these goals.
- Automate Reporting: Use dashboards to provide a clear, concise view of your key metrics without the noise of extraneous data.
Misinterpreting Correlation as Causation
A common pitfall in analytics is confusing correlation with causation. Just because two metrics move in tandem doesn’t mean one causes the other. For instance, a spike in project delays might correlate with increased client churn, but the underlying cause could be multifaceted.

How to combat this:
- Deep Dive Analysis: When you see trends, drill down into the data to understand the underlying factors.
- Controlled Experiments: Use A/B testing or pilot programs to validate hypotheses before scaling changes.
- Expert Consultation: Sometimes, getting an external perspective can help clarify data interpretations.
Resistance to Change
Implementing a data-driven culture can be met with resistance, especially in teams accustomed to traditional methods. People may be reluctant to trust numbers over intuition or may feel threatened by transparency.
How to combat this:
- Training and Education: Invest in training programs that help your team understand the benefits of analytics.
- Inclusive Culture: Involve team members in the data collection and analysis process, making them stakeholders in the transformation.
- Showcase Wins: Highlight success stories where data-driven decisions led to measurable improvements. This builds confidence and acceptance across the organization.
Putting It All Together: From Data to Action
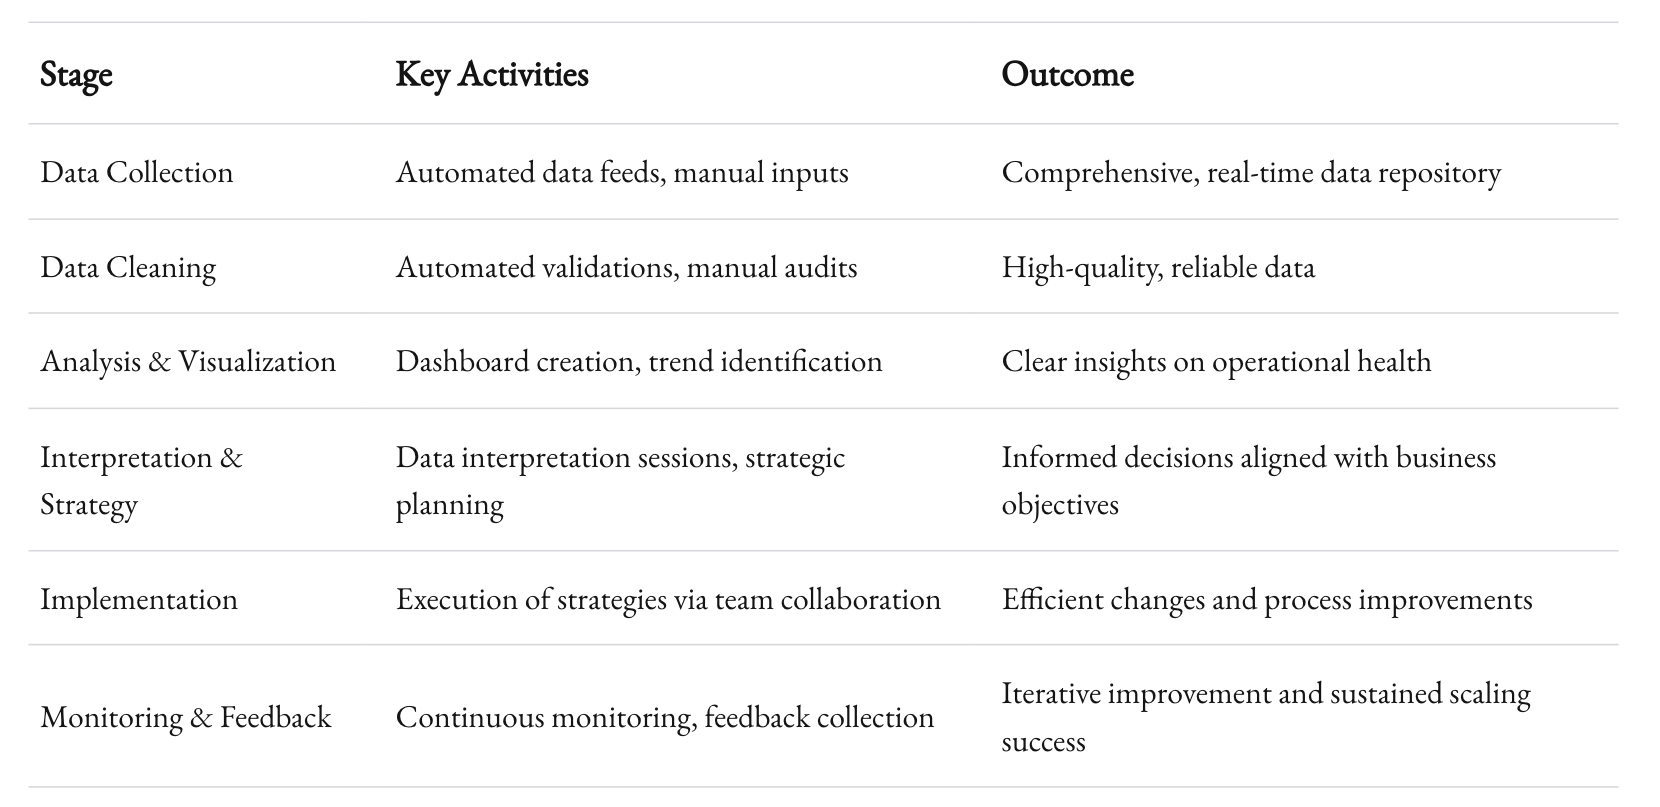
A Real-World Workflow
At 1985, our workflow for scaling decisions is iterative and data-centric. Here’s a glimpse into our process:
- Data Collection:
We continuously gather data from every project. Our integrated systems ensure that this data flows seamlessly into our centralized repository. - Data Cleaning and Validation:
Before any analysis, we validate the data. This involves automated checks and manual reviews to ensure accuracy and consistency. - Analysis and Visualization:
Once the data is clean, we use our dashboards to visualize trends. This step is crucial. It’s where raw numbers transform into insights. For example, a sudden dip in code quality might be immediately visible on our dashboard, prompting further investigation. - Interpretation and Strategy:
The insights derived from our analysis lead to actionable strategies. In one instance, a dip in sprint velocity correlated with increased multitasking among developers. The strategy? Reevaluate project assignments and reduce context switching. - Implementation:
Strategies are implemented across teams. We use collaboration tools to ensure that every stakeholder understands the changes and their rationale. - Monitoring and Feedback:
Post-implementation, we closely monitor the impact. Feedback loops, both internal and from clients, help us adjust our strategies in real time.
The Impact on Scaling
This process has had a tangible impact on our growth. Data-driven decisions have allowed us to scale efficiently, ensuring that every expansion is supported by solid metrics. The result is a company that grows steadily without compromising on quality or client satisfaction.
This workflow isn’t static. It evolves as we grow and as new tools and methodologies emerge. The key is to remain agile, always ready to tweak processes based on the latest data insights.
Insights for the Outsourced Software Development Industry
Tailoring Analytics to Your Niche
The outsourced software development industry has unique challenges. Client demands are diverse, project scopes vary dramatically, and deadlines are often tight. In such an environment, generic analytics frameworks fall short. Here are a few nuanced insights specific to our industry:
- Client-Specific Dashboards:
Every client is unique. A one-size-fits-all dashboard might obscure the nuances of individual projects. Tailor dashboards to reflect the specific KPIs that matter to each client. This not only enhances client satisfaction but also allows for a more detailed internal analysis of project-specific performance. - Resource Allocation Algorithms:
Use predictive analytics to optimize resource allocation. For instance, historical data can reveal which types of projects require additional QA resources or which teams excel in rapid development. Fine-tuning your resource allocation based on past performance can improve efficiency dramatically. - Agile Metrics Beyond Velocity:
While sprint velocity is a common metric, it doesn’t tell the whole story. Consider metrics like “defect escape rate” (the rate at which bugs slip into production) or “feature cycle time” (the time from feature inception to deployment). These metrics provide a deeper insight into both the efficiency and the quality of your agile processes. - Client Feedback Integration:
Integrate client feedback directly into your analytics. Quantify qualitative feedback wherever possible. For example, sentiment analysis on client communications can help predict potential issues before they escalate into major problems. - Market Trends and Technology Shifts:
The software industry evolves rapidly. Analytics should not only focus on internal metrics but also track external trends. Keep an eye on emerging technologies, changing client demands, and competitor performance. This holistic view allows you to anticipate market shifts and adjust your scaling strategies accordingly.
The Value of Benchmarking
Benchmarking against industry standards is a powerful way to ensure your analytics are on target. However, it requires nuance. Rather than comparing yourself to broad averages, look for benchmarks from companies that share similar business models and client demographics. For example, a study by McKinsey might reveal that agile teams in the tech services industry deliver projects 20% faster than traditional teams. Use such insights to set realistic, yet ambitious, targets for your own teams.

Benchmarking can be summarized in a quick checklist:
- Identify relevant peers: Focus on companies within the outsourced software development space.
- Gather industry reports: Utilize reputable sources like McKinsey, Gartner, or Forrester.
- Set actionable targets: Use benchmarks to inform your KPIs and performance goals.
- Review periodically: Markets change. Ensure that your benchmarks are updated regularly to reflect the current landscape.

Long-Term Strategies for Sustainable Growth
Integrating Analytics with Business Strategy
Analytics isn’t a standalone function. It must be woven into the fabric of your business strategy. At 1985, every scaling decision is backed by data. We don’t treat analytics as an afterthought; it’s a core pillar of our strategy. When planning for the future, consider how every facet of your business can be measured and improved.
For example, if you’re considering entering a new market segment, use analytics to gauge the potential demand, understand competitor dynamics, and forecast the resources needed to succeed. This holistic approach ensures that your scaling decisions are not just based on internal performance but also on external market realities.
Investing in Talent and Technology
Scaling effectively requires more than just the right data. It requires the right people and the right technology. Invest in training your team to interpret and act on analytics. At 1985, we hold regular workshops and training sessions to keep our team updated on the latest analytics tools and methodologies.
Similarly, don’t shy away from investing in new technologies that can enhance your data capabilities. Whether it’s upgrading your dashboards, exploring machine learning for predictive analytics, or adopting new integration tools, every investment in technology is an investment in your company’s future.
Adapting to Change and Fostering Agility
The business landscape is constantly evolving. New challenges emerge, and what worked yesterday might not work tomorrow. An effective analytics strategy is dynamic. It evolves with your business. At 1985, we continuously refine our metrics, update our tools, and adjust our strategies to remain ahead of the curve.
Agility is key. Encourage your team to experiment and learn from data. Not every initiative will yield immediate success, but each experiment provides valuable insights. Embrace a mindset of continuous improvement, where every failure is just a stepping stone to greater success.
Recap
Implementing effective analytics isn’t just a technical exercise—it’s a strategic imperative. At 1985, we’ve seen firsthand how a robust analytics framework can transform the way we scale our business. From integrating diverse data sources and choosing the right metrics to fostering a culture of transparency and continuous learning, every step is designed to ensure that our scaling decisions are both informed and strategic.
Analytics has allowed us to move away from guesswork. It has given us a roadmap to identify bottlenecks, optimize operations, and deliver unparalleled value to our clients. The journey isn’t always smooth. There are challenges—data overload, resistance to change, and the risk of misinterpreting data. But by focusing on what matters and continually refining our approach, we’ve built a system that supports sustainable, long-term growth.
In an industry as dynamic as outsourced software development, standing still is not an option. To scale effectively, you must be willing to invest in analytics, to listen to the data, and to act on the insights it provides. The future belongs to those who can harness the power of data to navigate uncertainty and drive success.
Remember: scaling is not about rapid, unchecked growth. It’s about measured, strategic expansion based on real-world insights. And that’s what effective analytics delivers—a clear, reliable guide through the complex landscape of modern business.


