How Can We Optimize Our Database Performance for Large-Scale Operations?
Say goodbye to slow queries and hello to a high-performance database with these smart strategies.

When we started 1985, an outsourced software development company, one of the recurring nightmares was this: databases struggling under the weight of scale. Slow queries. Angry users. And server costs spiraling out of control. Sound familiar?
Let’s be honest. Optimizing database performance isn’t glamorous. But it’s the backbone of any large-scale operation. When your database works well, no one notices. When it doesn’t, your entire operation screeches to a halt.
This blog post isn’t about covering the basics. If you’re here, you already know what an index is. Instead, we’ll dive into nuanced strategies, hard-earned insights, and actionable tips that can make a real difference for your high-traffic application.

Why Performance Matters More Than You Think
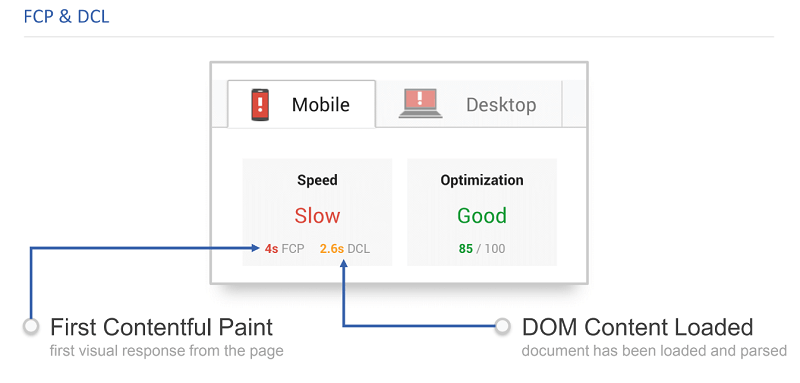
Most teams focus on features. But performance is a feature. A slow application is an unusable application. Studies show that even a one-second delay in page load time can reduce conversions by up to 7% (source: Aberdeen Group). Imagine what that means for large-scale operations handling millions of requests daily.
Beyond user experience, poor performance also hits your bottom line. Hosting costs increase when inefficient queries hog resources. Worse, downtime from database bottlenecks can cripple businesses. Just ask any e-commerce site during Black Friday.
Optimizing database performance isn’t just a “good-to-have”. It’s table stakes for scaling successfully.
Understand Your Query Patterns
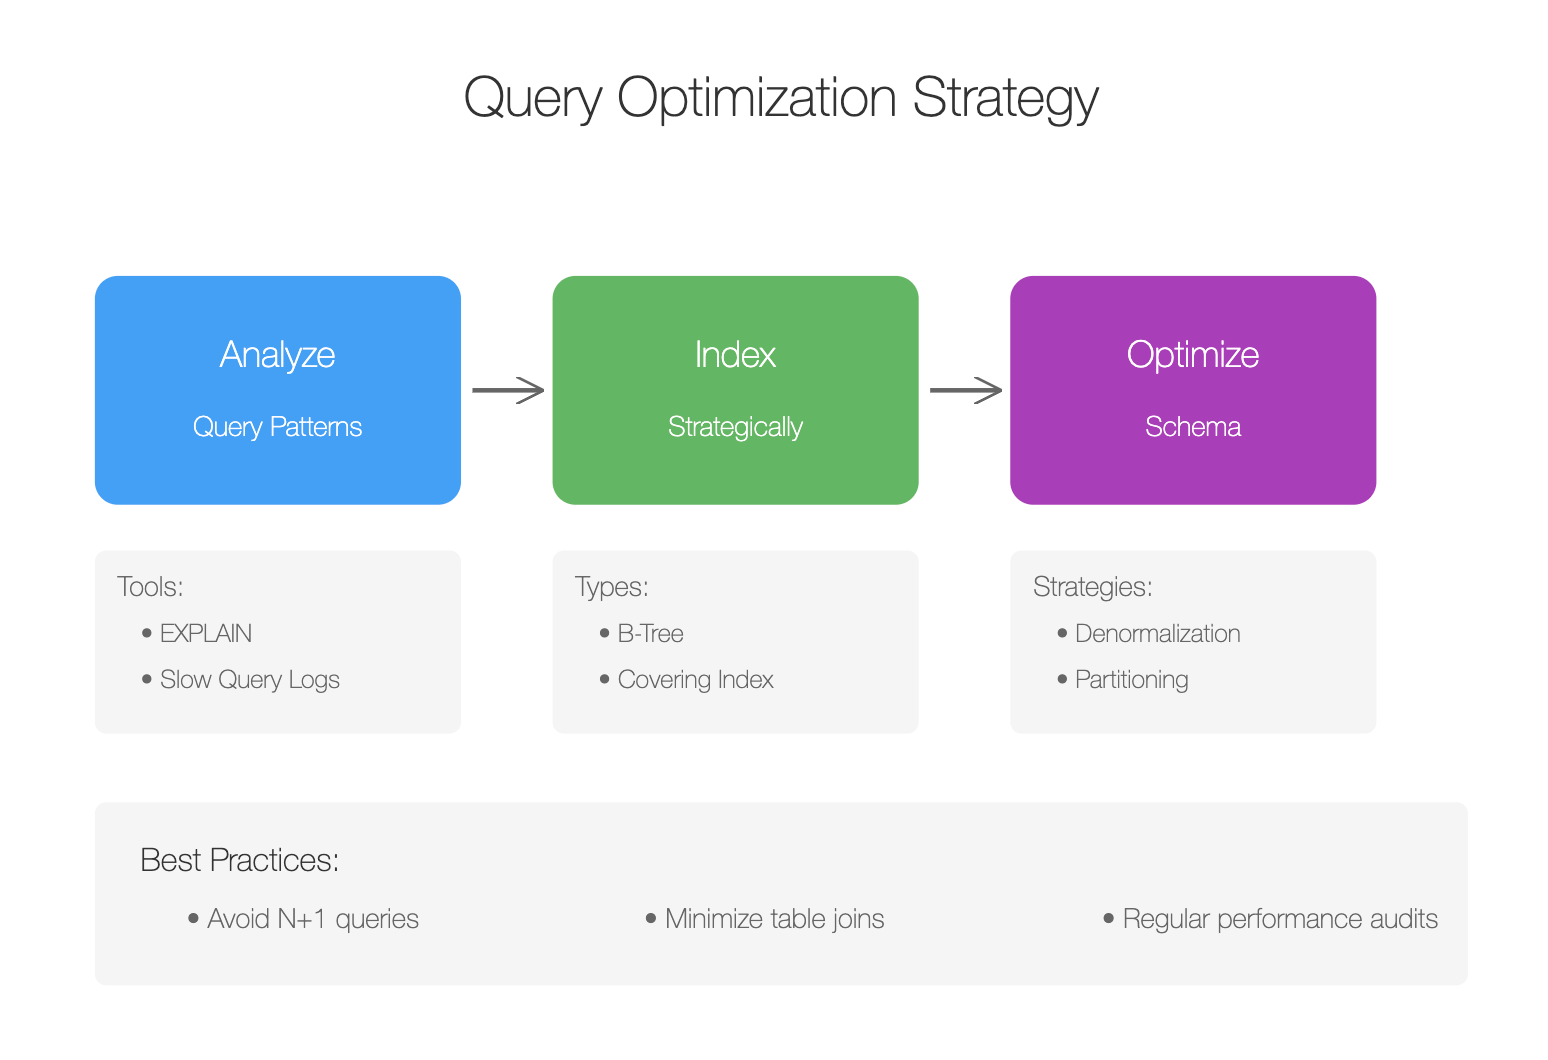
One of the biggest mistakes teams make is treating their database like a black box. You need visibility. Before optimizing anything, start by understanding how your application interacts with the database.
Tools to Analyze Queries
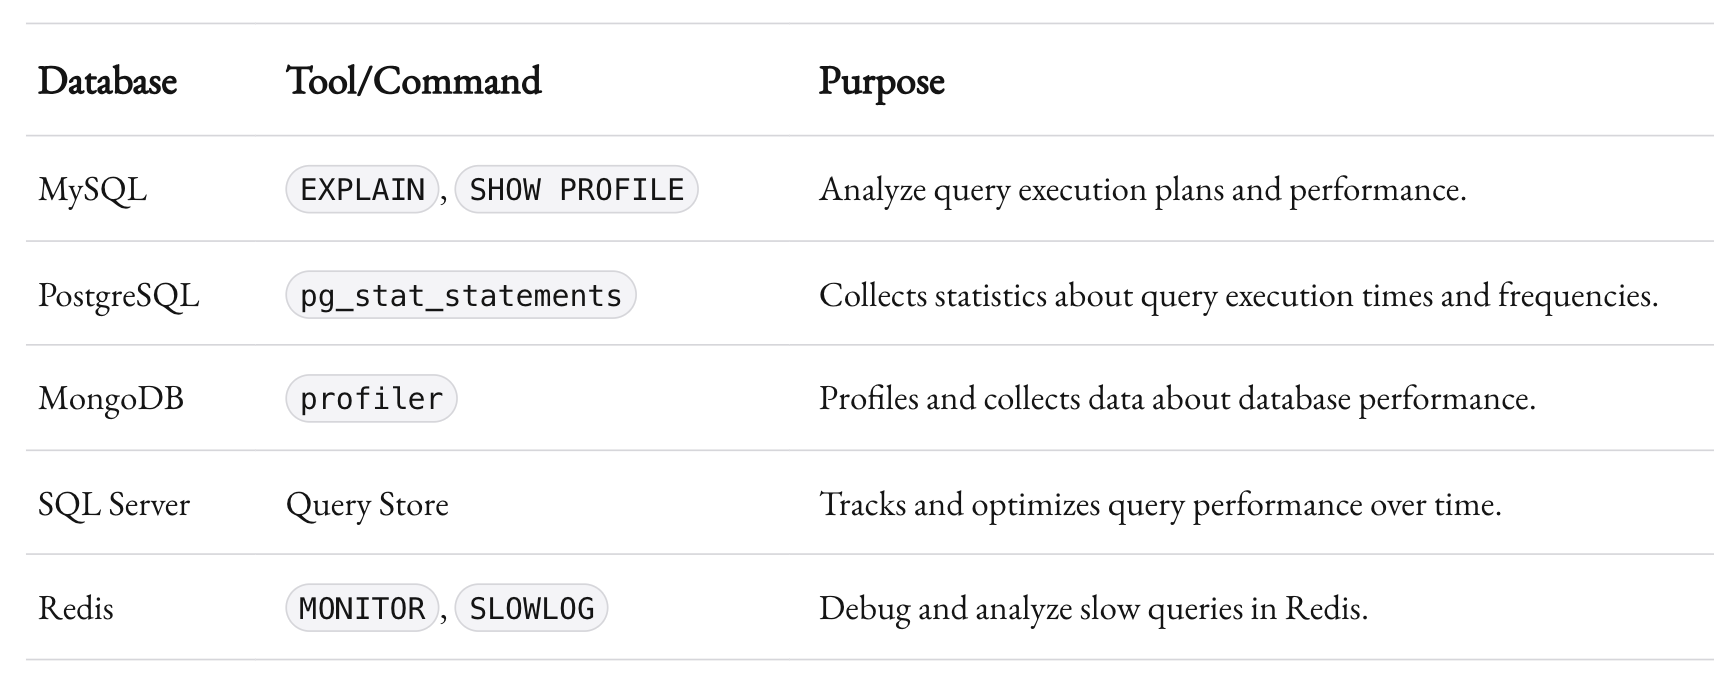
Modern databases come with profiling tools to help you pinpoint slow queries. For example:
- MySQL: Use
EXPLAINorSHOW PROFILEto dissect query performance. - PostgreSQL: The
pg_stat_statementsextension provides detailed insights into query execution times. - MongoDB: The
profilercollects data about performance and operations.
Pro tip: Regularly review slow query logs. They’re a goldmine for identifying low-hanging fruit.
Common Culprits
When analyzing query patterns, keep an eye out for:
- N+1 Query Problems: Where one query triggers additional queries for each result.
- Missing Indexes: Leading to full table scans and excessive read operations.
- Over-fetching Data: When queries pull more data than needed. (Do you really need every column?)
Understanding patterns isn’t sexy. But it’s the foundation for everything else.
Indexing Done Right
Indexing is like caffeine. A little can supercharge your system. Too much, and it’ll give you a headache.
Choosing the Right Index
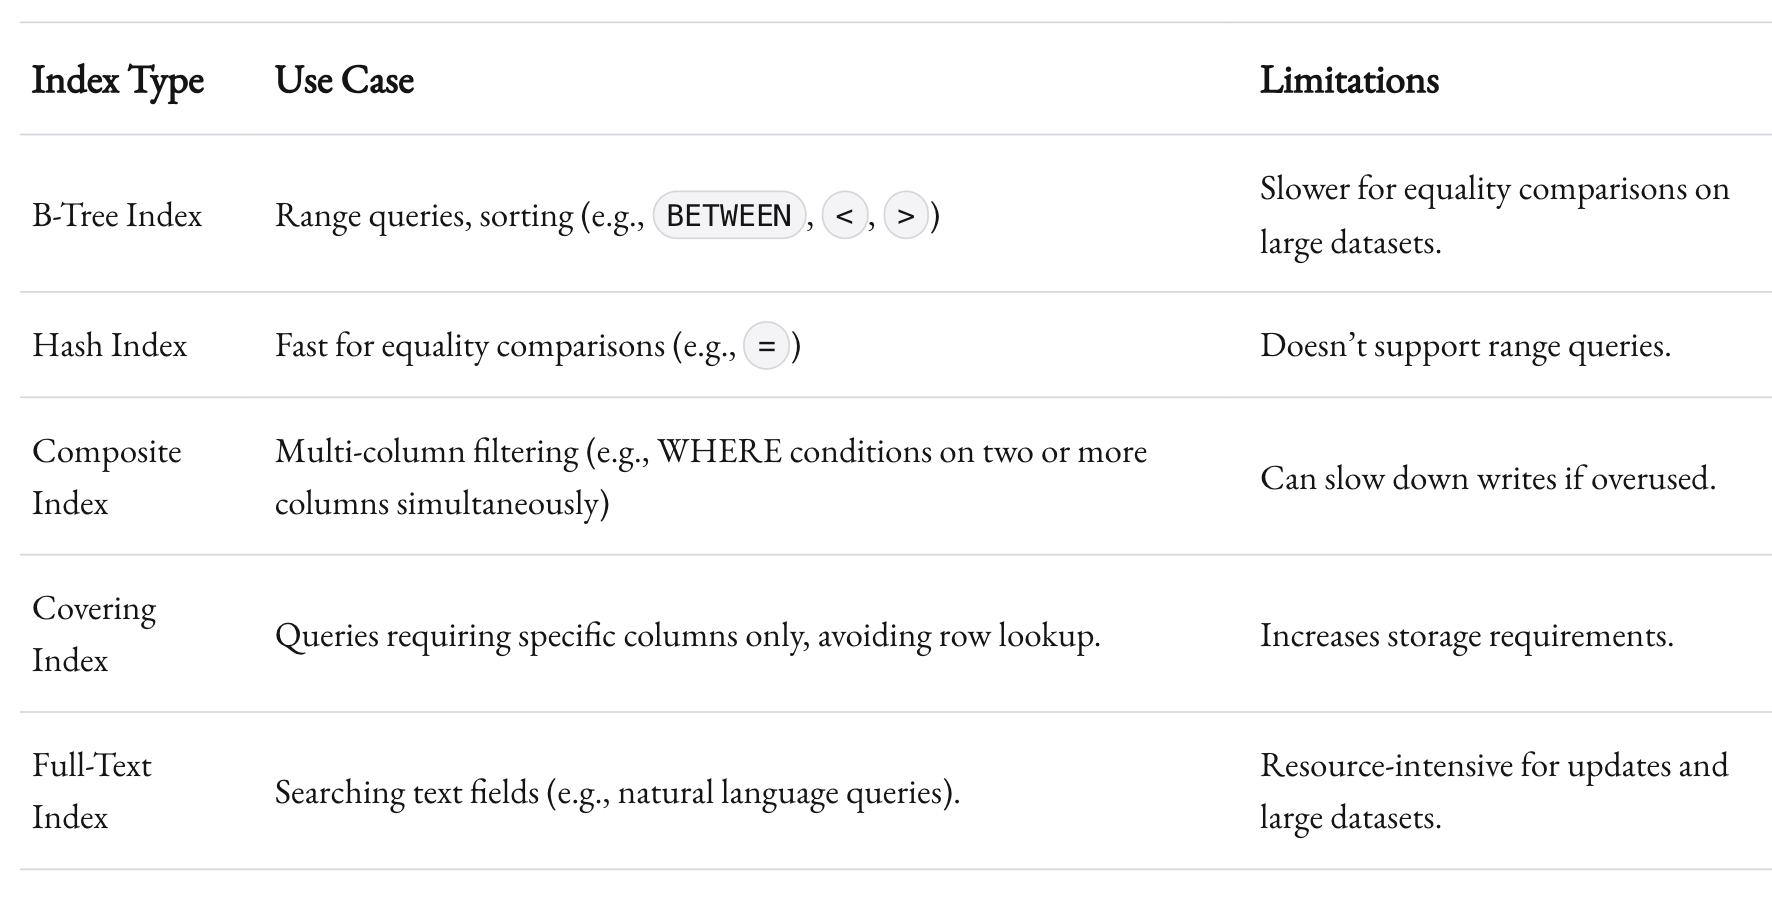
Not all indexes are created equal. Each type has trade-offs:
- B-Tree Indexes: Great for range queries (e.g.,
BETWEEN,>,<). - Hash Indexes: Faster for equality comparisons but terrible for range scans.
- Composite Indexes: Useful when queries filter by multiple columns.

Avoid Over-Indexing
Here’s the trap: over-indexing slows down writes. Every INSERT, UPDATE, or DELETE operation has to update all relevant indexes. A general rule? Only index what you query frequently.
Pro Tip: Covering Indexes
For read-heavy applications, consider covering indexes. These include all the columns needed by a query, so the database doesn’t need to fetch additional rows. For instance:
CREATE INDEX idx_orders_user_date ON orders (user_id, order_date);
This works wonders for queries like:
SELECT order_date FROM orders WHERE user_id = ?;
Optimize Your Schema
Sometimes, performance problems aren’t about queries. They’re about the underlying schema.
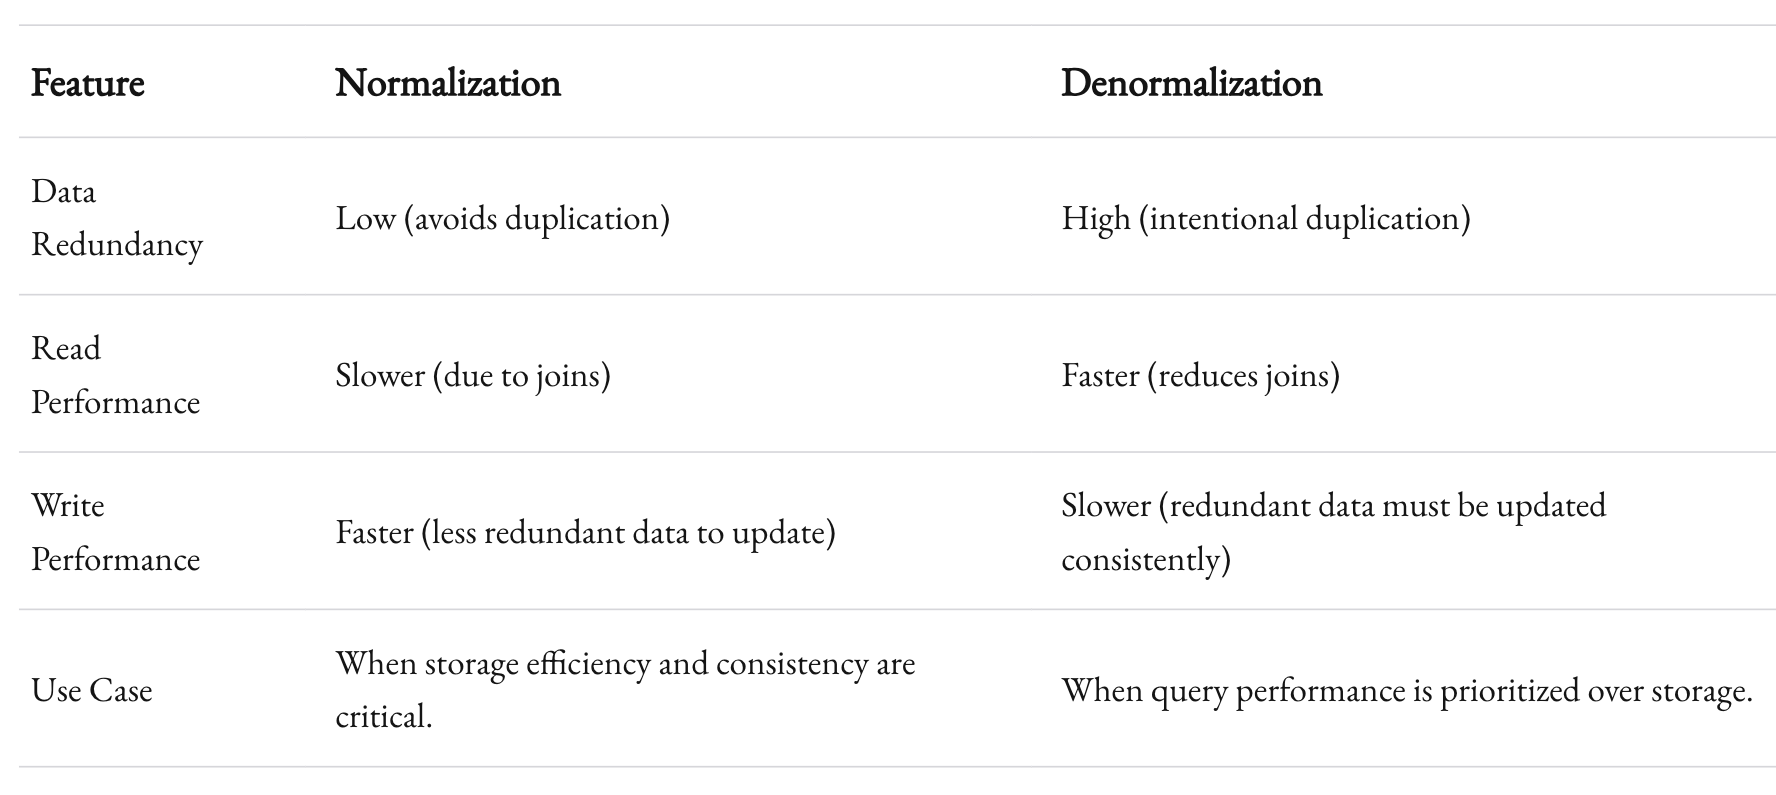
Normalize or Denormalize?
Database theory preaches normalization to avoid redundancy. But in practice, denormalization often wins for performance at scale. For example:
- Instead of joining
usersandorders, store user details directly in theorderstable. Yes, it’s redundant. But it’s fast.

Partitioning for Scalability
Partitioning breaks large tables into smaller, manageable chunks. Think of it like splitting a bulky Excel sheet into tabs. Strategies include:
- Range Partitioning: Split data based on ranges (e.g., dates).
- Hash Partitioning: Distribute rows based on a hash function.
Partitioning not only improves query performance but also simplifies archiving and backup strategies.
Pro Tip: Avoid Too Many Joins
Joins are powerful but expensive. Complex queries with 4+ joins can grind systems to a halt. When possible, flatten your data model to reduce join dependencies.
Caching: The Unsung Hero
Why hit the database at all if you can avoid it?
Types of Caching
- In-Memory Caching: Tools like Redis and Memcached store frequently accessed data in memory.
- Query Caching: Many databases, like MySQL, offer built-in query caching.
- Application-Level Caching: Store computed results in your app logic.
Cache Invalidation
Caching isn’t foolproof. The hardest part is invalidation. Always ensure that cached data reflects the latest state of your database. Stale caches can lead to bugs.
Pro Tip: Cache Wisely
Not every query benefits from caching. Prioritize expensive, read-heavy queries that rarely change.
Tuning Database Configuration
Out-of-the-box settings rarely work for large-scale operations. Most databases ship with conservative defaults to avoid breaking on small servers. Here’s how to tune them for scale:
Key Parameters
- Connection Pool Size: Too many connections can overwhelm the server. Tools like PgBouncer can help manage connections efficiently.
- Memory Allocation: Increase buffer sizes (e.g.,
innodb_buffer_pool_sizefor MySQL) to keep more data in memory. - Timeouts: Set reasonable timeouts to kill long-running queries automatically.
Monitor and Iterate
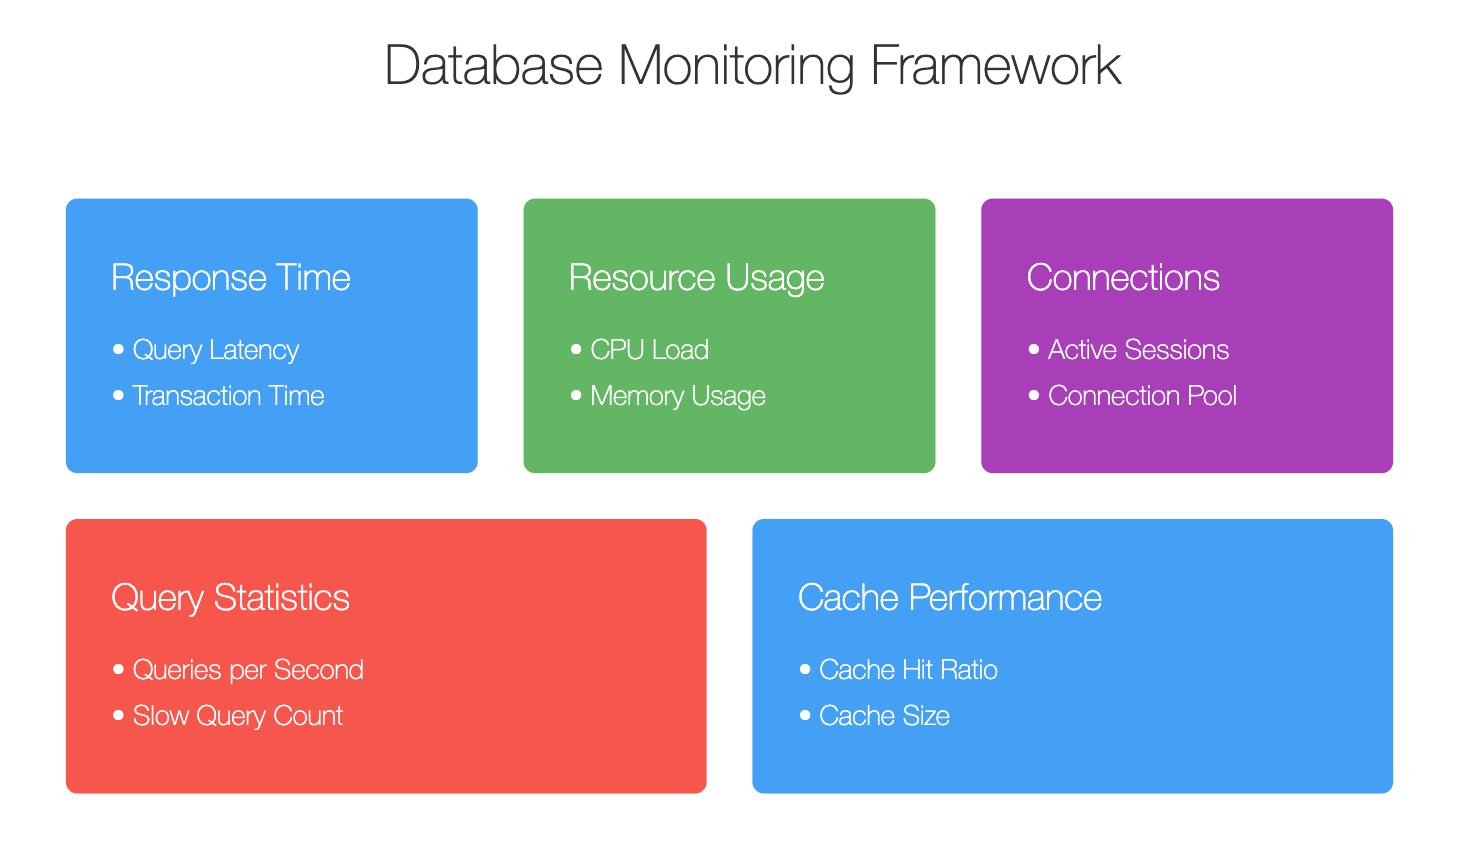
Optimization is an iterative process. Use tools like:
- New Relic: For application and database performance monitoring.
- Prometheus + Grafana: For visualizing database metrics.
- Database-Specific Dashboards: Most modern databases include built-in monitoring tools.

Handling High Write Loads
For write-heavy applications, bottlenecks often appear sooner than you expect.
Strategies to Scale Writes
- Batching: Group multiple
INSERTorUPDATEoperations into a single query. - Asynchronous Writes: Offload non-critical writes to background jobs.
- Sharding: Split data across multiple databases to distribute load.
Pro Tip: Use Write-Ahead Logging (WAL)
Databases like PostgreSQL use WAL to log changes before applying them. This speeds up recovery and improves write performance.
Make Performance a Habit
Optimizing database performance isn’t a one-and-done task. It’s a habit. It’s about regularly profiling, monitoring, and tweaking your system as your scale grows.
At 1985, we’ve seen firsthand how these strategies can transform a sluggish application into a high-performance powerhouse. It’s not easy. But it’s worth it.
Because when your database performs, your business thrives. And isn’t that the ultimate goal?


