Behind Your Chatty Microservices
Learn how to pinpoint bottlenecks and supercharge your microservices with actionable optimization techniques.


Microservices promised to change the way we build and scale software. They did, but at a cost. As an engineer or team lead, you know the drill—decomposing a monolith into smaller services gives you agility, scalability, and autonomy. But microservices come with their own complexities, particularly in how they communicate. It’s not just code talking to code; it’s about systems orchestrating an intricate dance of data exchange, often in unpredictable ways.
If you're struggling to manage noisy microservice interactions, you're not alone. Let’s break it down and figure out how to monitor and optimize communication without pulling your hair out.
Why Microservices Are So Chatty
At their core, microservices are about breaking down applications into small, purpose-driven services. Each service does one thing well. But they don’t operate in isolation. Services need to work together, whether it’s fetching user data, processing payments, or updating a dashboard.
Here's where it gets tricky:
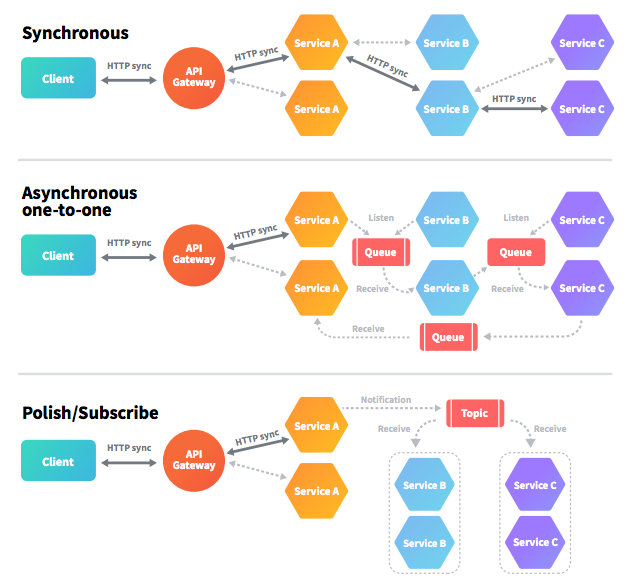
- High Volume of Requests: Microservices often rely on APIs, gRPC, or message queues to exchange data. A single user action can trigger dozens of calls.
- Synchronous Dependencies: When one service depends on another’s response to continue processing, latencies propagate through the system.
- Data Fragmentation: Data is often spread across multiple services, necessitating constant communication to retrieve the pieces.
For example, in an e-commerce app, adding an item to the cart might involve calls to inventory services, user services, and pricing engines. Each call might cascade into more calls.
The result? Your services are chatty, your network is congested, and your system slows down.
Monitoring Microservice Communication
If you don’t measure it, you can’t improve it. Monitoring is the foundation of optimizing microservice interactions. Let’s look at key strategies to keep an eye on.
Distributed Tracing
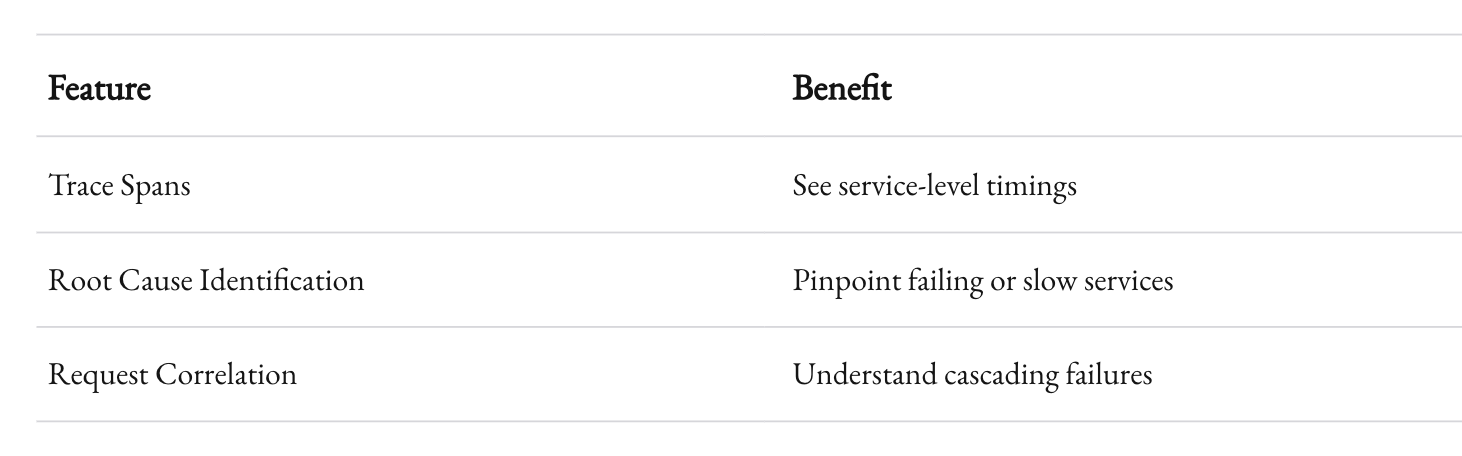
When a user clicks a button, their request can traverse dozens of services. Distributed tracing helps you map out this journey, giving you visibility into:
- The path of a request through your system.
- How long each service took to process the request.
- Bottlenecks causing delays.
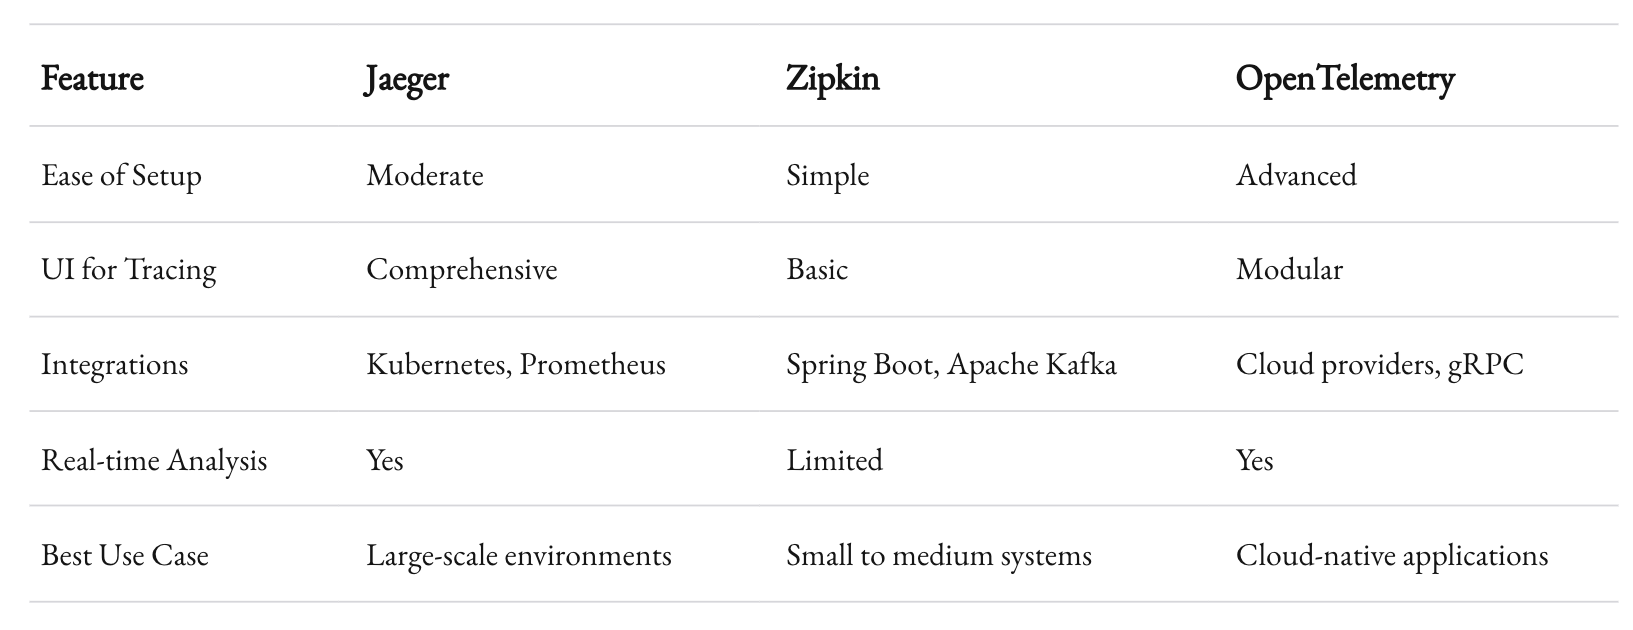
Tools like Jaeger or Zipkin integrate with your services to visualize traces. The benefits are immense:
Logging and Metrics
Logs are the bread and butter of observability. They provide detailed information about system events. But not all logs are created equal.
Log Guidelines:
- Use structured logging: Instead of free-text logs, use key-value pairs for better parsing.
- Centralize your logs: Use platforms like Elasticsearch or Splunk to aggregate logs across services.
- Add correlation IDs: Tie related logs together, making it easier to trace workflows.
Metrics complement logs by offering a bird’s-eye view:
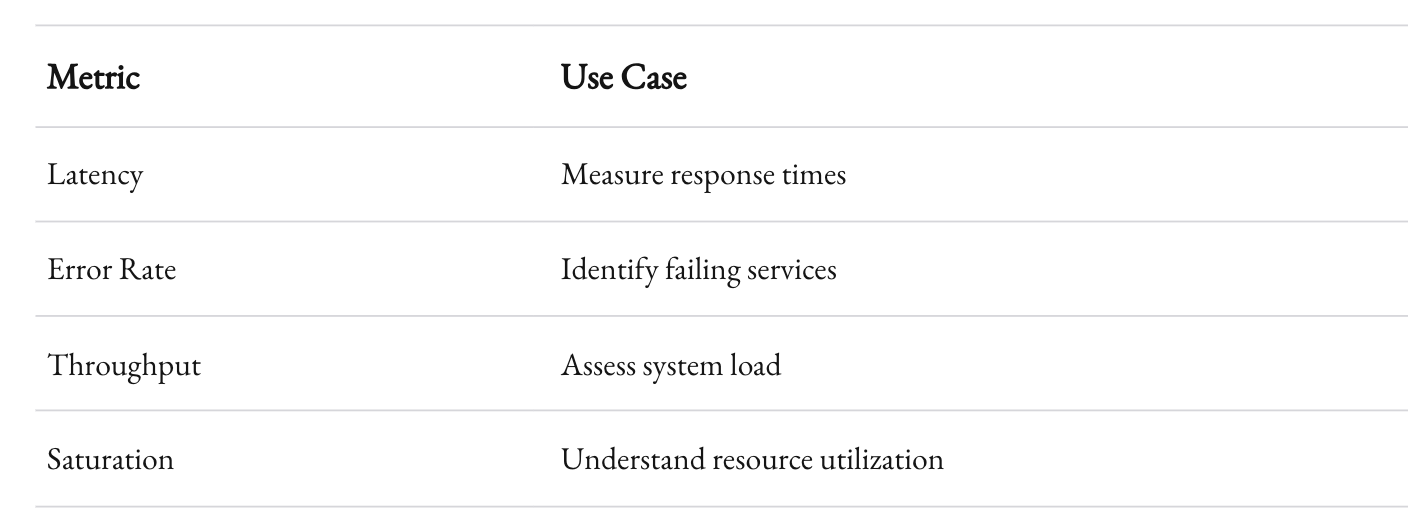
Prometheus and Grafana make an excellent combination for tracking metrics and visualizing them.

Common Bottlenecks and Their Fixes
Now that you know how to monitor your system, let’s talk about what to look for and how to address common issues.
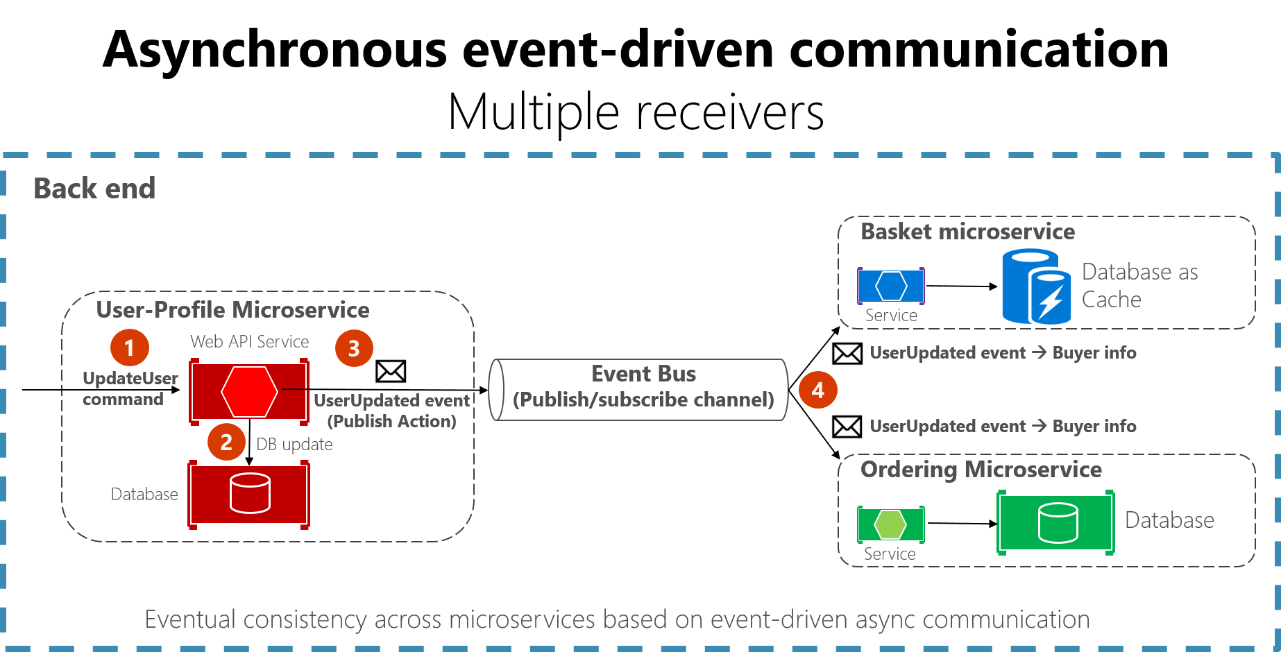
Too Many Synchronous Calls
Problem: Service A calls Service B, which calls Service C, and so on. If one service slows down, the entire chain suffers.
Fixes:
- Asynchronous Messaging: Use message queues like RabbitMQ or Kafka to decouple services.
- Circuit Breakers: Implement patterns like Hystrix to fail gracefully when a service is unavailable.
- Caching: Cache frequently used responses to reduce unnecessary calls.
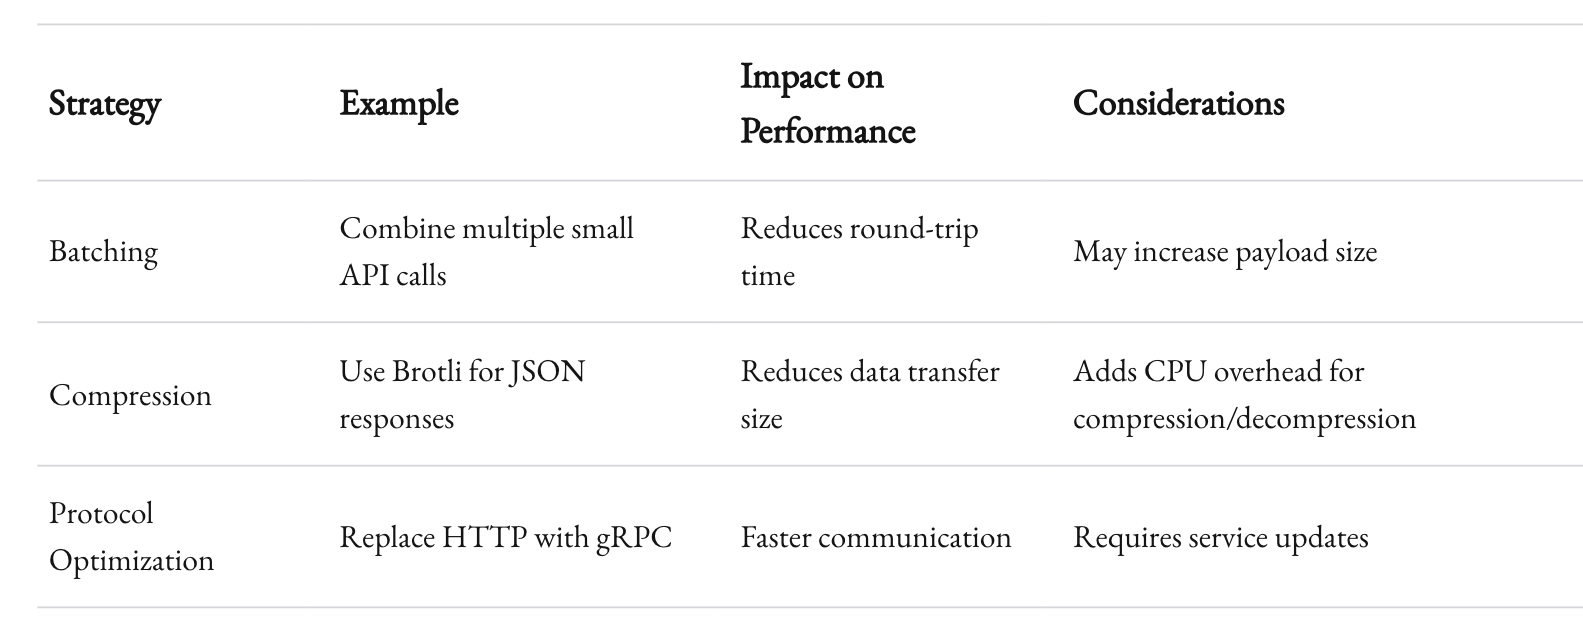
Overloaded Networks
Problem: High-volume communication saturates the network, increasing latency and costs.
Fixes:
- Batching: Group smaller requests into larger ones.
- Compression: Compress data payloads using libraries like Snappy or Brotli.
- Protocol Optimization: Replace HTTP with binary protocols like gRPC for faster communication.
Inefficient Data Retrieval
Problem: Services fetch too much or too little data, leading to additional calls.
Fixes:
- GraphQL: Fetch only what you need, no more, no less.
- Joins at the Service Level: Implement joins within your service logic instead of retrieving fragmented data.
- Database Tuning: Index your data effectively and avoid N+1 query issues.
Optimizing for the Long Haul
Monitoring and fixing immediate bottlenecks is just step one. To build resilient systems, optimization must become part of your engineering DNA.
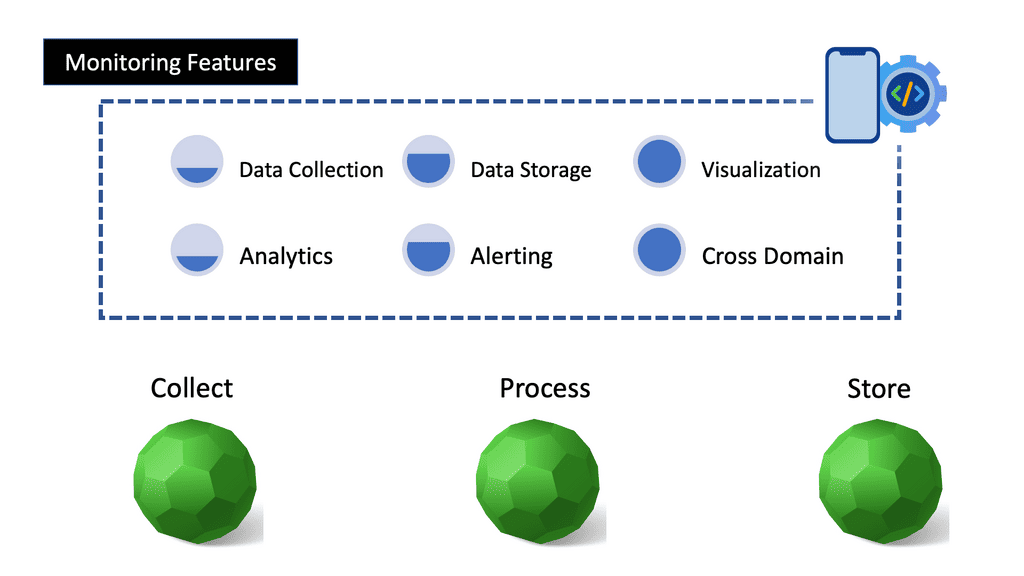
Embrace Observability as Culture
Tools are great, but they’re not the solution. A culture of observability ensures teams prioritize visibility from day one:
- Instrument Early: Add monitoring hooks when writing new code.
- Define SLAs and SLOs: Commit to measurable performance objectives.
- Share Dashboards: Make metrics accessible to all teams.
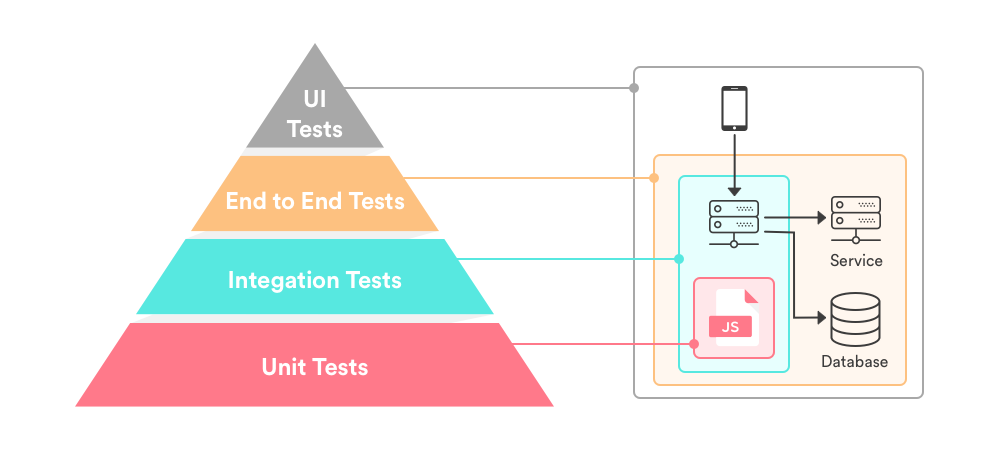
Use Smart Load Testing
Your system may perform well during normal operations, but what happens under stress? Load testing tools like k6 or Locust can simulate high traffic.
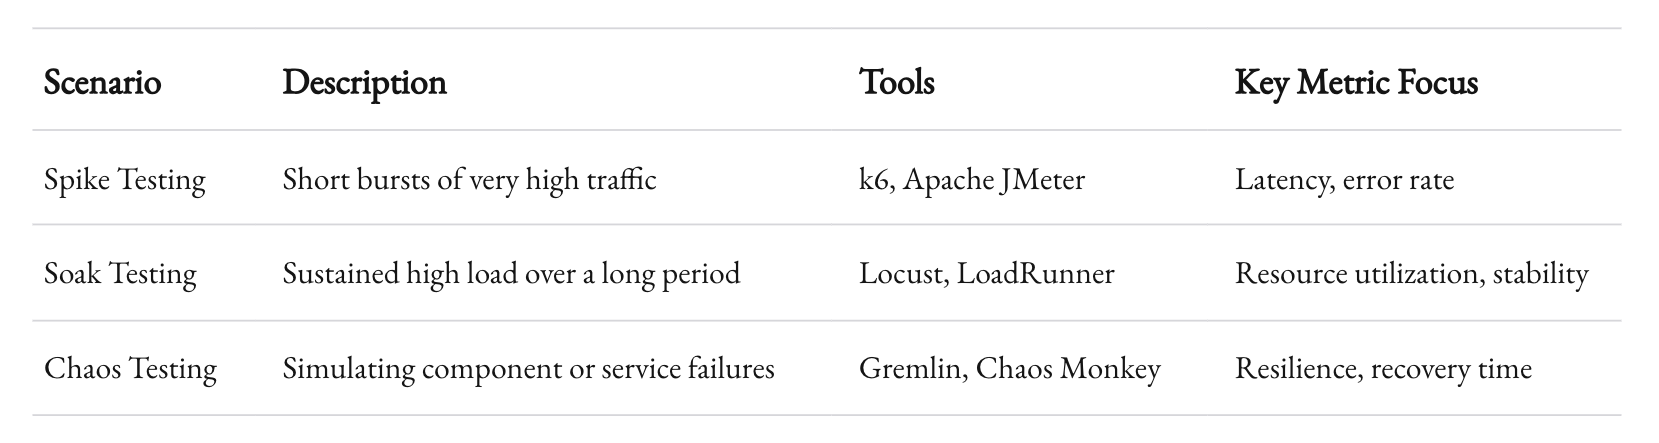
Key Scenarios:
- Spike Testing: Short bursts of high traffic.
- Soak Testing: Sustained high load over time.
- Chaos Testing: Simulate failures and measure resilience.
Automate Performance Reviews
Manual reviews are tedious and error-prone. Automate them by:
- Running nightly or weekly performance tests.
- Setting alerts for SLA breaches.
- Automatically scaling services based on metrics.

Recap
Microservices thrive on communication, but without careful monitoring and optimization, that chatter can spiral out of control. By understanding your system's unique communication patterns and investing in the right tools and practices, you’ll ensure your services talk less and do more.
At 1985, we’ve seen firsthand how nuanced optimizations can transform microservice architectures. Whether it’s adopting asynchronous communication or fine-tuning distributed traces, small changes make a big difference. Start small, but think big. And don’t let your services chat too much—they’ve got work to do.


